
Figure 3.
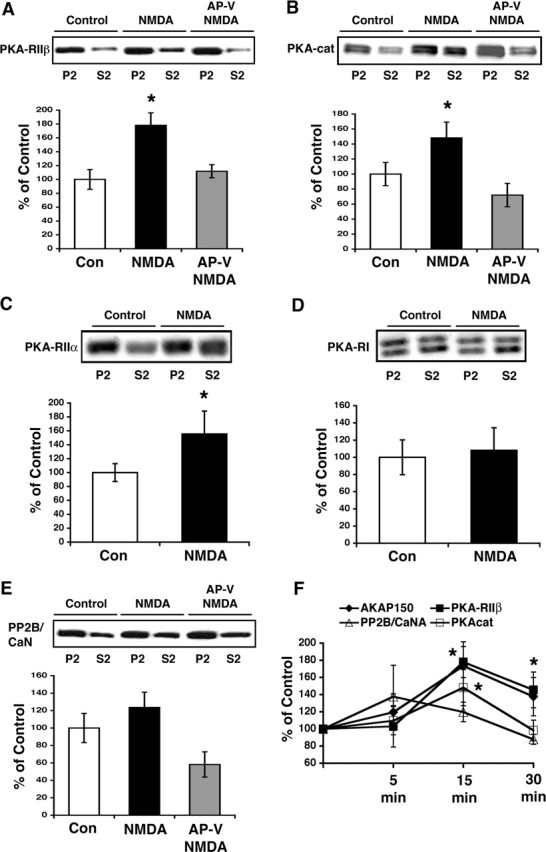
Chem-LTD NMDA treatment causes a redistribution of PKA-RII regulatory subunits and PKA catalytic but not PKA-RI or PP2B/CaN A subunits in hippocampal CA1 minislices. A, PKA-RIIβ immunoreactivity in S2 increases 15 min after NMDA treatment. PKA-RIIβ redistribution is blocked by pretreatment with AP-V (top panel). Calculation of PKA-RIIβ S2/P2 immunoreactivity ratios normalized to control shows a 78 ± 18% increase after NMDA (*p < 0.05; n = 10; ANOVA). B, PKA catalytic immunoreactivity shifts into cytosolic fractions in response to NMDA (top panel) with the S2/P2 ratio calculated to be increased by 48.2 ± 21% (bottom panel) (*p < 0.05; n = 11; ANOVA). The antibody recognizes both α and β forms of the PKA catalytic subunit. C, PKA-RIIα immunoreactivity also redistributes from P2 to S2 in response to chem-LTD treatment (top panel). This somewhat more variable, yet still significant, shift represents a 55.4 ± 33% increase in the S2/P2 ratio after NMDA treatment (*p < 0.05; n = 8; t test). D, PKA-RI immunoreactivity does not redistribute in response to NMDA (top panel) with the S2/P2 ratio calculated to be 108 ± 8% of control (p > 0.05; n = 8; t test). E, PP2B/CaN A subunit immunoreactivity also shows little redistribution in response to NMDA (top panel) with only a slight S2/P2 ratio increase (bottom panel) (23.6 ± 17%) that does not reach statistical significance (p > 0.05; n = 10; ANOVA). The antibody recognizes both α and β forms of the PKA-RI subunit. F, Line graph illustrating the effects of chem-LTD on the localization of AKAP150 and associated proteins at various times after NMDA. Increases in AKAP150 (closed diamond) and PKA-RIIβ (closed square) S2/P2 distributions parallel each other with little change seen in the distributions of PP2B/CaN A (open triangle). PKA catalytic (open square) subunit appears to shift only at the 15 min time point. The asterisks denote significance from the respective control for AKAP150, PKA-RIIβ, and PKA catalytic at the indicated time points only (p < 0.05; ANOVA). Data are expressed as mean ± SEM.