
Figure 11.
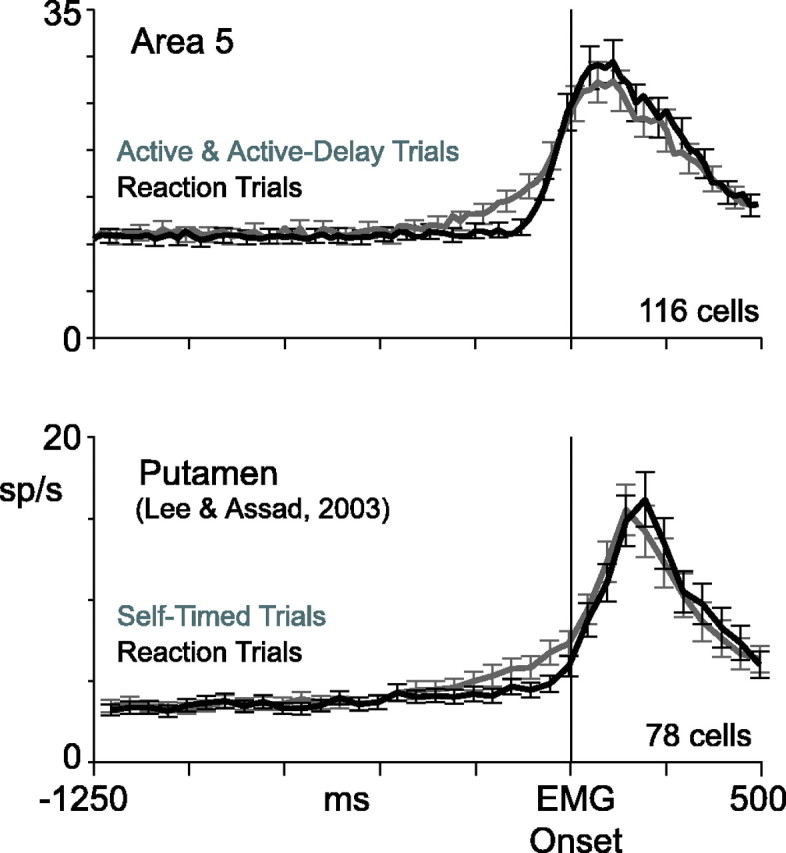
Area 5 versus putamen. Top, Population-averaged histograms from the current data set. Active and active-delay trials were pooled together and averaged. Bottom, Population-averaged data from phasically active neurons in the putamen (Lee and Assad, 2003). Original data have been realigned to earliest EMG onset, as determined by eye using the EMG curves of Figure 4 in Lee and Assad (2003). Error bars indicate SE.