
Figure 2.
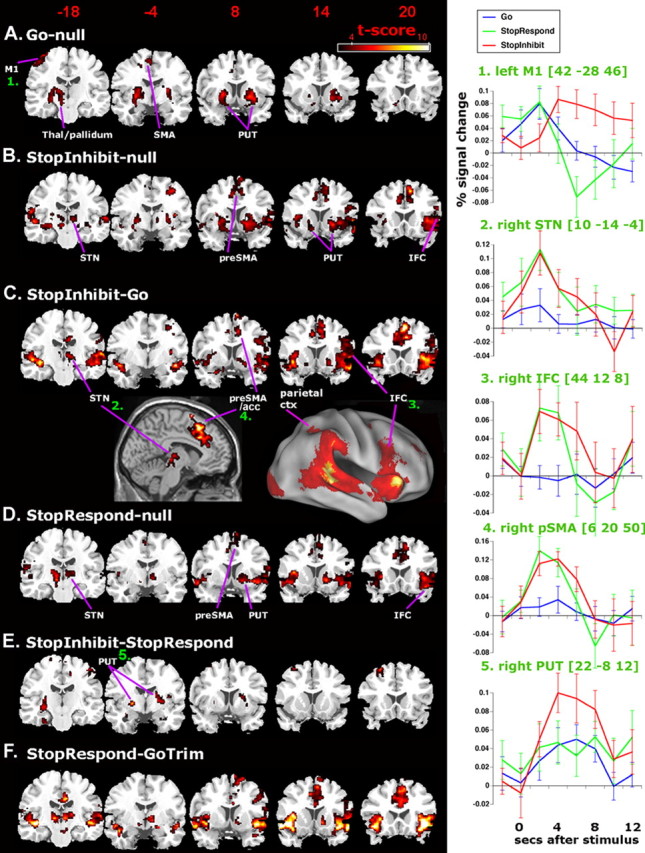
Activated networks for Going and Stopping and key peristimulus time courses for the hemodynamic response. Images are in neurological format (right = right). Activations are overlaid on coronal slices from the SPM single-subject structural template. All maps are thresholded at t > 3.05 voxel level, p < 0.05 cluster corrected for whole brain. A, Go trials activate contralateral motor cortex (M1), SMA, bilateral putamen (PUT), and left thalamus/pallidum, consistent with a fronto-striatal pathway. B, StopInhibit trials activate auditory cortex, parietal cortex, right STN, medial frontal cortex, bilateral putamen, and bilateral orbital/insula cortex extending into the opercular IFC in the right hemisphere. These activations include those associated with preparing to execute a Go response as well as the response inhibition network revealed, more precisely, by the contrast of StopInhibit–Go (C). This network includes right-lateralized STN, IFC, GP, and pre-SMA (also shown on saggital and surface rendered images). This network is also activated on StopRespond trials (D). E, StopInhibit trials activate bilateral putamen more than StopRespond, but this is not the case for StopRespond–GoTrim (F), which contrasts trials on which the subject tried to stop, but could not, with trials on the which the subject did not try, while controlling for response speed. On the right of the figure are shown peristimulus plots (with SEs) for different trial types for key foci. For these, mean activation for each subject was extracted from a sphere (radius, 4 mm) centered on the peak group-activated voxel. Note the differential effects of Go, StopInhibit, and StopRespond on the time course of the estimated BOLD response in left motor cortex in particular (inset, top right): StopInhibit trials have a delayed response, whereas StopRespond trials peak at the same time and amplitude as Go trials but then show a strong undershoot as if the inhibition occurred too late. Surface rendering for the lateral view was created by mapping the group-averaged fMRI data into a population-averaged surface atlas using multifiducial mapping (Van Essen, 2005). Thal, Thalamus; acc, anterior cingulate cortex; ctx, cortex.