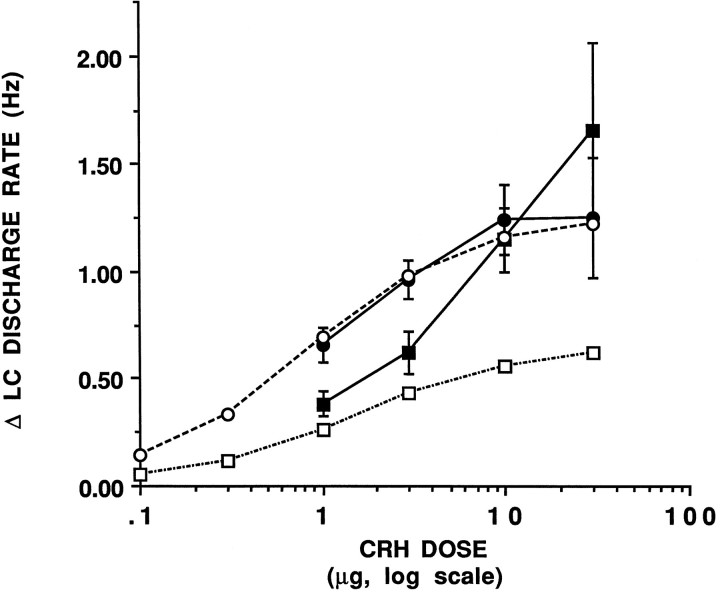
Fig. 3.
CRF dose–response curves in sham-operated and adrenalectomized rats. The abscissa indicates the dose of CRF(log scale), and the ordinate indicates the increase in LC discharge above pre-CRF rates (Δ Hz). Solid symbols represent experimental data, and open symbols represent theoretical curves. Solid circles show the CRF dose–response curve generated in sham-operated rats. Solid squares represent the experimentally determined CRF dose–response curve in adrenalectomized rats. Each point represents the mean of 4–10 cells, vertical lines represent mean ± 1 SEM. Open circlesrepresent the theoretical curve based on the equation E =Emax[CRF]/ED50 + [CRF] and assuming that Emax = 1.25 Hz and ED50 = 0.82 μg. Open squares represent the theoretical curve that would be expected in adrenalectomized rats based on additivity, E = (Emax[CRF + 0.8]/Kd + [CRF + 0.8]) − 0.6.

