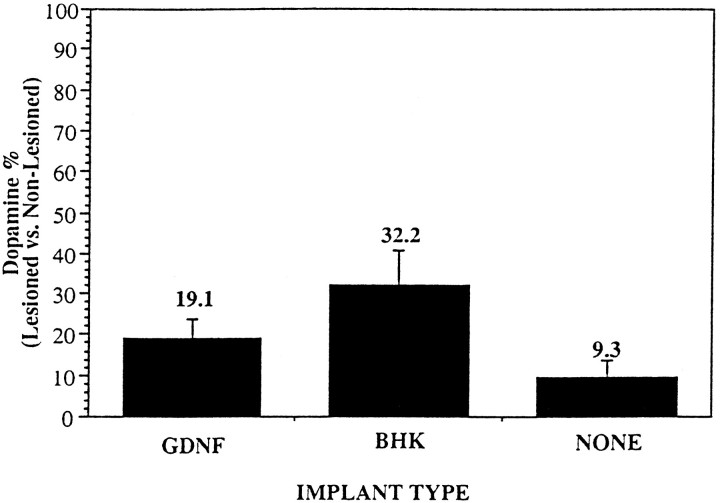
Fig. 3.
Histogram showing the percentage of striatal dopamine content of the right (lesioned) side versus the left (nonlesioned) side, as determined by HPLC analysis. Each striatal content was normalized to the amount of protein present in the sample.GDNF, Animals that received an implant containing BHK-GDNF cells (n = 11); BHK, animals that received an implant containing BHK control cells (n = 6); NONE, animals that received no implant (n = 8). Values are mean ± SEM.

