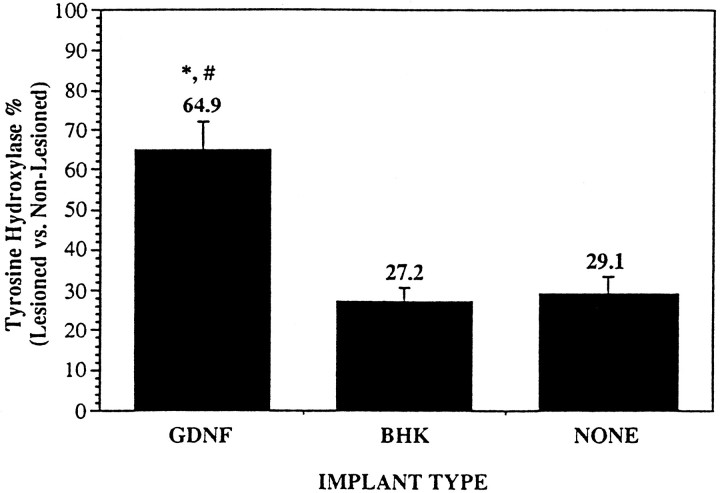
Fig. 5.
Histogram showing the percentage of TH-positive SN pars compacta neurons on the right (lesioned) side versus left (nonlesioned) side. Counts are based on at least 12 sections throughout the whole SN. Total number of calculations is described in Materials and Methods. *p < 0.0015 (vs NONE); #p < 0.0003 (vs BHK), ANOVA. Values are mean ± SEM.

