
Fig. 1.
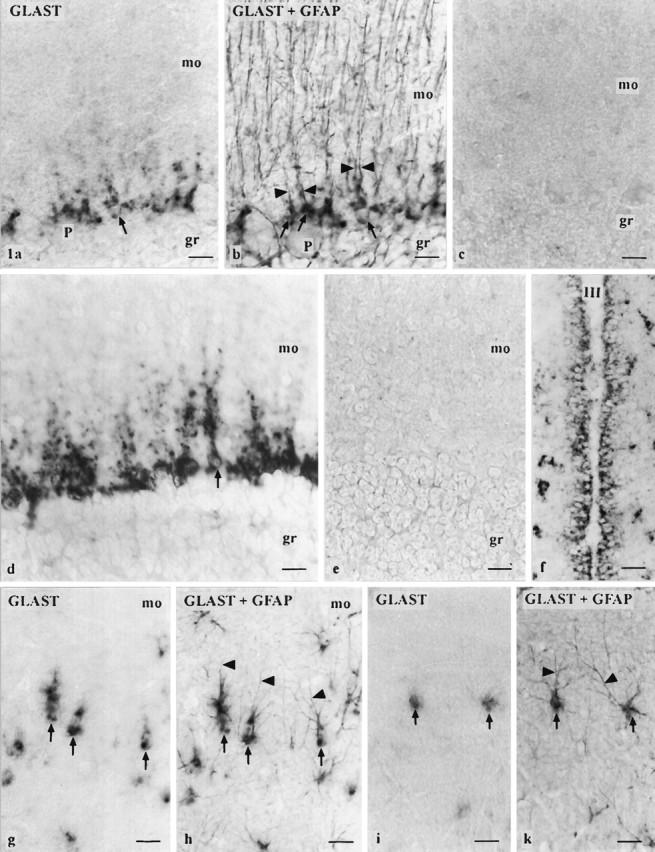
Cellular distribution of GLAST mRNA.a/b, g/h, and i/k are micrograph pairs showing sections after ISH using the cRNA probe in the first and after additional GFAP immunostaining in the second figure. GFAP-immunoreactive processes (arrowheads) allow identification of ISH-reactive cells as Bergmann glia (arrows) in the cerebellar cortex (mo, molecular layer; gr, granule cell layer;P, Purkinje cell soma) and as astrocytes (arrows) in the mo of the hippocampal dentate gyrus (g/h) and in the outer parietal cortex (area 1; i/k). d,f, Micrographs of sections after ISH using the oligonucleotide probe. Bergmann glia is strongly labeled (d). A single Bergmann glia cell can be clearly identified (arrow) showing staining around the nucleus and in the proximal processes. A strong labeling is also observed in ependymal cells (f) of the third ventricle (III) adjacent to the arcuate hypothalamic nucleus. No labeling is observed using the sense cRNA probe (c; cerebellar cortex) or the oligonucleotide probe in the presence of a 100-fold excess of unlabeled oligonucleotide probe (e; cerebellar cortex). Scale bars, 20 μm.