
Fig. 4.
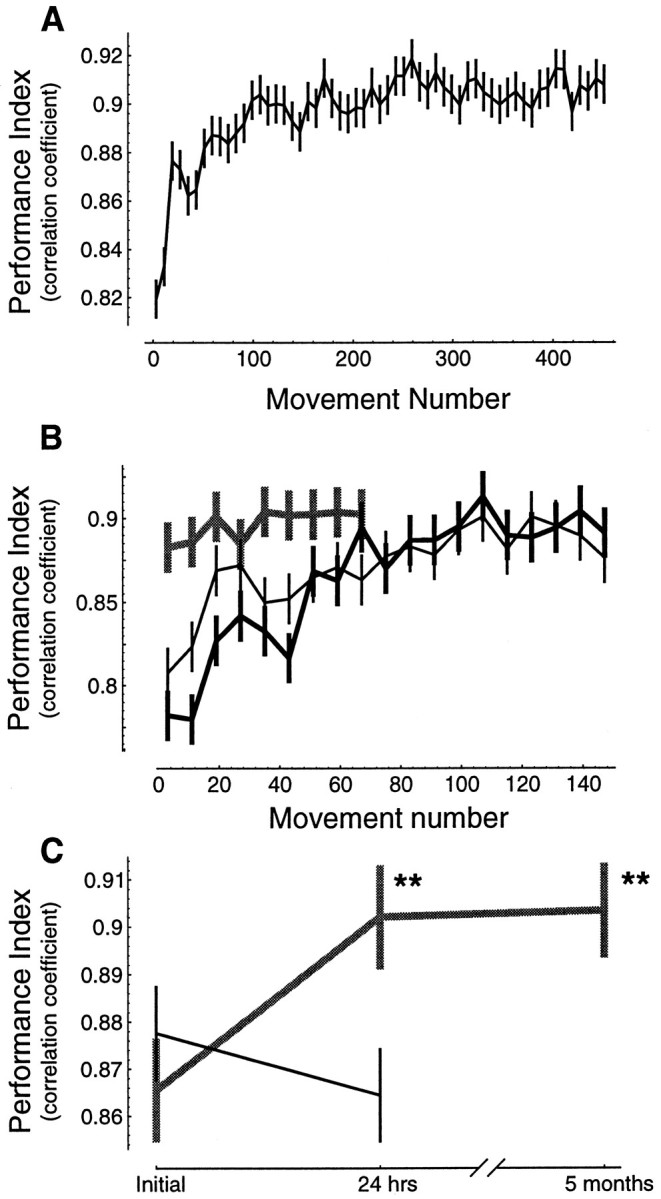
Performance during initial training in a force field and subsequent tests of recall. Performance index is a correlation between the hand trajectory in the force field and the hand trajectory in the null field (baseline trajectories, as in Fig.2A). A, Mean performance ± 95% confidence intervals for all subjects (n = 60). For each subject, groups of eight consecutive movements are binned together (there were 8 different directions of movement, and target directions were presented in random order). B, Initial performance in a field and performance 24 hr later. All lines are mean performance ± 95% confidence intervals. Thin line, Performance of naive subjects (n = 18) in field B1. Thick black line, Performance of a subset of these subjects (n = 8) in a novel field,B2, measured 24 hr after training inB1. Thick gray line, Performance of the remaining subjects at 24 hr on fieldB1. C, Summary performance scores ± 95% confidence intervals for the two groups of subjects. Gray line represents subjects that were tested on the field in which they were trained. Black linerepresents subjects that at 24 hr were tested on a novel field.