
Fig. 3.
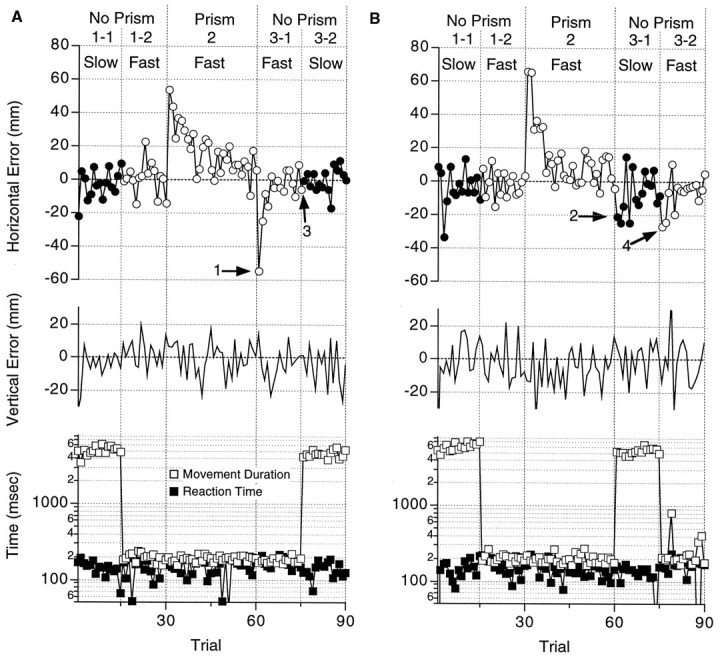
Errors in two experiments (subject TY, base-left prisms) testing the transfer of adaptation from the fast to the slow reaching movements. A, Data under condition I from Figure1B. Open and filled circles in thetop panel show the horizontal errors relative to the target in the fast and the slow reaching task, respectively. Horizontal errors (ordinate) were measured in the direction of visual displacement in Epoch 2 and plotted against the trial sequence (abscissa). Vertical errors are shown in the middle panel with upward errors in the positive direction. Reaction times (filled squares) and movement durations (open squares) are plotted (ordinate, log scale) against trial sequence in the bottom panel. Vertical dotted linesshow the borders between Epoch 1-1, 1-2, 2, 3-1, and3-2. Required task movements (fast or slow) and the existence or absence of prisms (prism or no prism) are shown above.B, Data under condition IV from Figure 1B. Axes and symbols are the same as in A. Note the difference between the horizontal errors in Epoch 3 of B (arrows 2 and 4) and A (arrows 1and 3).