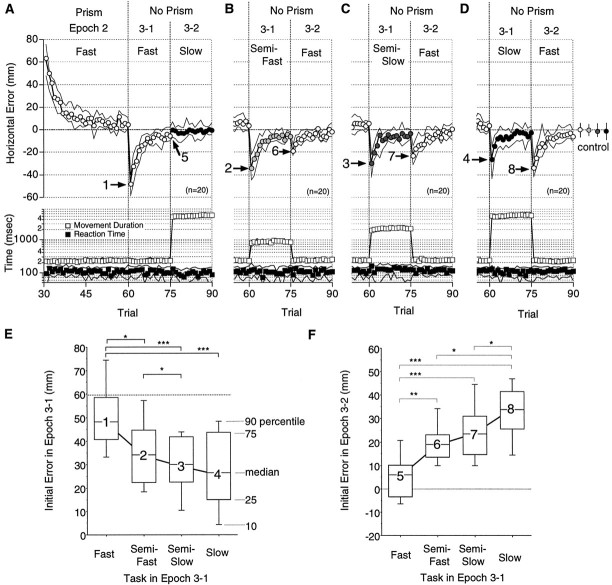
Fig. 4.
Velocity specificity of prism adaptation with fast reaching. A–D, Circles in the top panel show the median horizontal errors (n = 20) for 10 subjects under conditions I (A), II (B), III (C), and IV (D) from Figure 1B. Open, light-shaded, dark-shaded, and filled circles show errors from trials in the Fast, Semifast, Semislow, and Slowreaching tasks, respectively. The median horizontal errors for the four tasks in Epoch 1 (control) are indicated by circles at theright-hand side. Error bars indicate 25 and 75 percentiles. The median movement duration (open squares) and reaction time (filled squares) are shown in the bottom panel. The medians (symbols) lie between the 25 and 50 percentiles shown by solid lines. Note that most of the 25 and 75 percentiles of the movement duration (open squares) are hidden under the symbols. Data in Epochs 2 and 3 are shown inA, whereas only those in Epoch 3 are shown inB–D. Other notations are the same as in Figure 3. E, F, Distributions of the initial errors in Epoch 3-1 (E) and Epoch 3-2 (F) shown, respectively, for the required task movement in Epoch 3-1. Note that in F errors in the last trial of Epoch 3-1 are shown for the fast reaching task (5). Each box plot shows the 10, 25, 50, 75, and 90 percentiles of distribution. Numbers on the box plots correspond to arrows 1–8 in A–D. Note the decrease from 1 to 4 and the increase from 5 to 8. The medians were 48, 34, 30, and 26 mm for 1–4, and 6, 19, 23, and 34 mm for 5–8, respectively. Significant differences are indicated bybrackets with asterisks (*p < 0.05; **p < 0.01; ***p < 0.001; Wilcoxon signed rank test).

