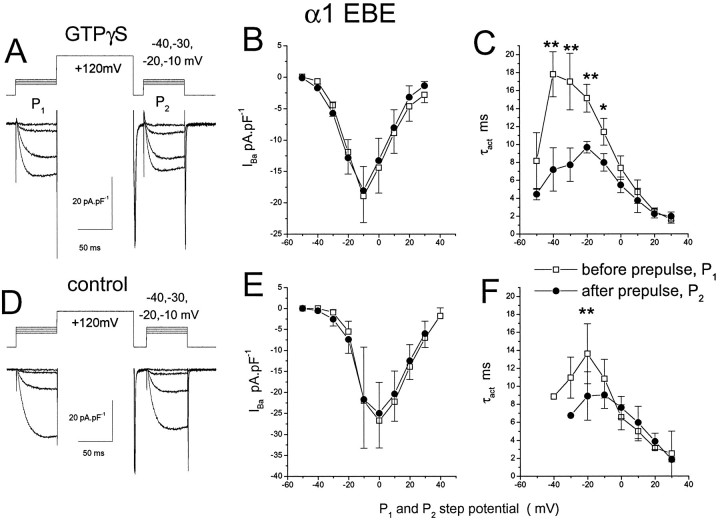
Fig. 5.
Cells were transfected with the α1EBE chimera, together with α2-δ and β1b, and experiments were performed exactly as described in the legend to Figure 4. The mean ± SEM is given for nine GTPγS-modulated and five control cells. The statistical significance of difference between both τactand IBa amplitude evoked inP1 (□), andP2 (•) was determined by pairedt test; *p < 0.01, **p < 0.001.

