
Fig. 3.
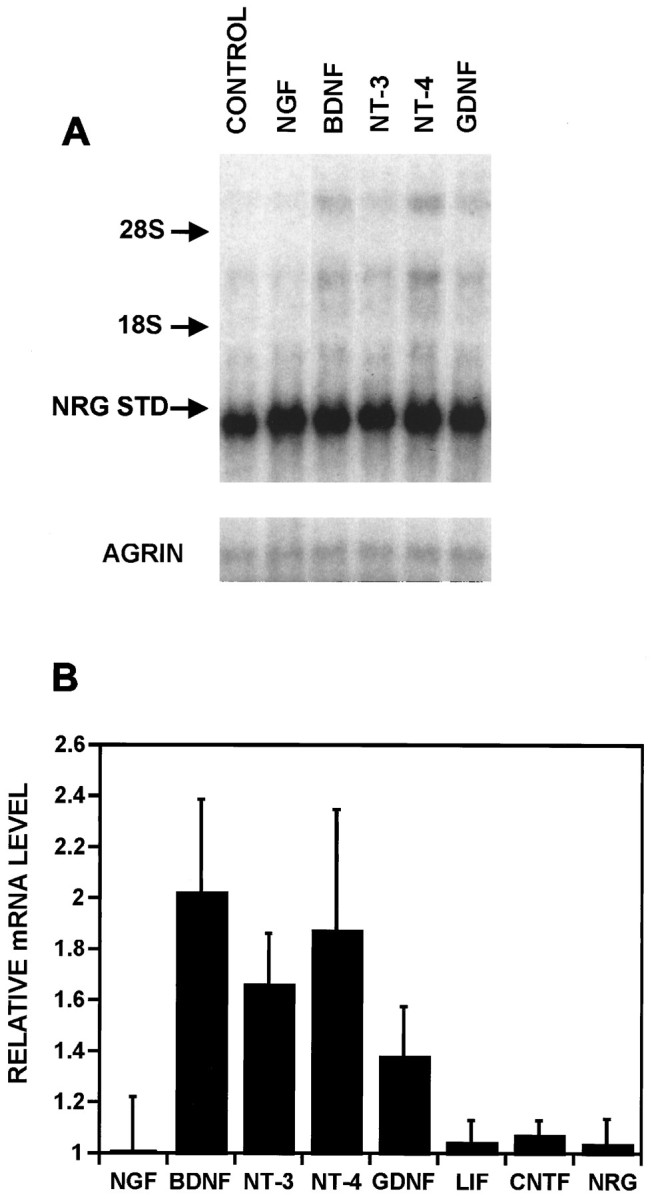
A subset of neurotrophic factors stimulate NRG expression. A, Neurons treated with carrier (CONTROL), NGF, BDNF, NT-3, NT-4,or GDNF at 100 ng/ml each for 4 hr were analyzed by Northern blots first probed for NRG and then reprobed with an agrin probe shown below. In this particular blot, the density of the cultures was lower than in Figure 2, demonstrating a reduced intensity of the top transcript and a corresponding increase intensity of the NRG standard RNA. B, The results of these and other experiments (all performed as in A) were quantified by normalizing each of the three transcripts to the NRG loading standard and expressing the sum of the three transcripts as a ratio to untreated control cultures. The results are expressed as the average normalized values ± SEM with NGF, n = 5; BDNF,n = 6; NT-3, n = 6; NT-4,n = 2; GDNF, n = 2; LIF,n = 3; CNTF, n = 3; NRG,n = 3.