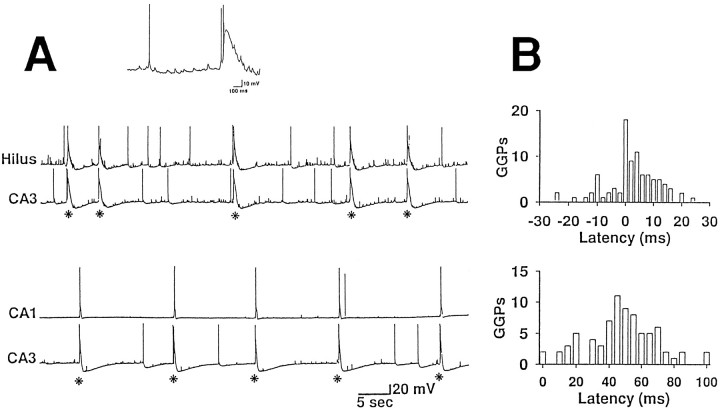
Fig. 1.
Correlation between GGPs occurring in different hippocampal subfields. A, Pair of recordings obtained at P4 from a hilar interneuron and a CA3 pyramidal neuron and from two pyramidal neurons of the CA3 and CA1 subfields. A single GGP is shown in the inset above the traces and marked by anasterisk in the traces. B, Cross-correlation histograms obtained from pairs of recordings shown inA. The top histogram (hilus taken as reference) has a narrow peak centered at zero (20% of the events) and a broader distribution grouped within 15 msec (51% of the events). Number of events, 90; bin width, 2 msec. In the bottomhistogram GGPs in CA1 are plotted as a function of the time after the event recorded from CA3. Number of events, 77; bin width, 5 msec.

