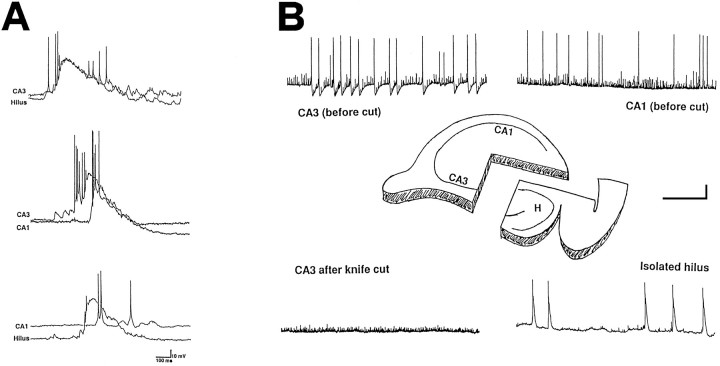
Fig. 2.
Giant GABAergic potentials were detected in the isolated hilus. A, Pairs of GGPs recorded from different hippocampal fields are superimposed. It can be observed that GGPs recorded in the hilus and CA3 region are almost synchronous, whereas those detected in the CA3–CA1 or hilus–CA1 occur with a latency of several milliseconds (also see text). B, Schematic representation of the experimental condition before and after isolation of the hilus by knife cut. GGPs were detected before the cut either in the CA3 (top left trace) or in the CA1 (top right trace) fields. After the knife cut, GGPs were still detected in the hilus (H, bottom right trace), whereas they were not detected either in CA3 (bottom left trace) or in CA1 fields (data not shown). Scale bars: 20 mV vertical; 30 sec horizontal, except for the bottom right trace, which is 6 sec.

