Fig. 11.
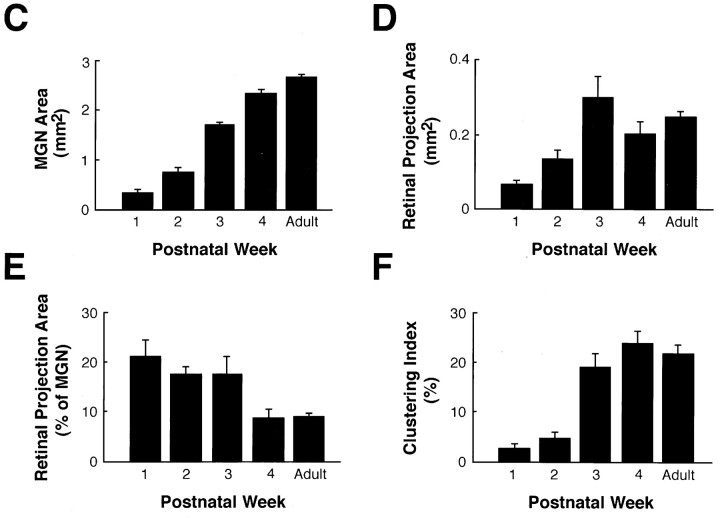
Summary of the developmental changes occurring in the MGN and the retino-MGN projections in rewired ferrets.A, B, Pseudocolored representations of normalized optical densities of CTB-labeled retinal projections to the MGN at P8 (A) and adulthood (B). The brightest red, denoted as 100% in the color key, represents the densest staining and corresponds to median CTB labeling in the LGN (see Materials and Methods). A andB are computer-generated images of the same MGN coronal sections shown in Figures 8B and 1D, respectively. Arrow inA points to the same cluster marked by anarrow in Figure 8B.Arrows in B point to clusters in the adult projection. Dorsal is up; medial is to theright. Scale bars, 200 μm. C, Histogram indicating the area of MGN (including all its subdivisions) as a function of age. D, Histogram of the area of retinal projections to the MGN as a function of age. E, Histogram indicating the percentage of the MGN area innervated by retinal fibers as a function of age. F, Histogram of the percentage of retinal projections forming clusters (clustering index; see Materials and Methods) as a function of age. For number of animals analyzed in each developmental group, see Materials and Methods. Error bars indicate SEM.

