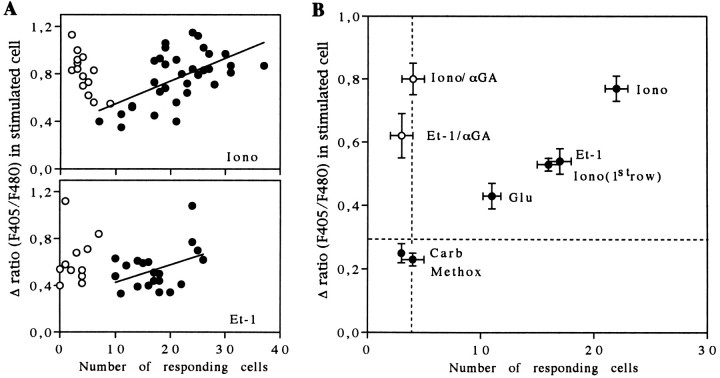
Fig. 7.
Relationship between the amplitude of [Ca2+]i increases induced by pharmacological stimulation and the extent of intercellular calcium signaling.A, Top diagram, Plot of [Ca2+]i changes generated by focal application of ionomycin (50 μm) against the number of responding cells in the absence (filled circles) and in the presence (open circles) of 18α-GA (10 μm). In control conditions, the extent of the intercellular calcium signaling was correlated with the magnitude of the initial [Ca2+]i response in the stimulated cells, as indicated by a linear regression fit.A, Bottom diagram, Plot of [Ca2+]i changes evoked by focal application of Et-1 (0.1 μm). Data were fit with the plot of a linear regression equation. B, Average plot of the extent of intercellular calcium signaling, indexed by the number of responding cells, against the amplitude of the [Ca2+]iresponse in the cells stimulated by specific pharmacological agents. Experiments performed with 18α-GA (10 μm) defined a restricted area in which no intercellular calcium signaling occurred (vertical dashed line). Note that in the presence of the uncoupling agent intercellular calcium signaling is blocked without any change in amplitude of the [Ca2+]i response. With methoxamine (Methox) and carbachol (Carb), no intercellular calcium signaling was triggered, as indicated by the low number of responding cells, which is similar to that observed with endothelin-1 (Et-1) and ionomycin (Iono) when gap junctions are inhibited. With glutamate (Glu), endothelin-1, and ionomycin focal applications, higher [Ca2+]i responses in the stimulated cells were monitored, and intercellular calcium signals were recorded. For these three trials, the averaged initial [Ca2+]i increase was greater than threshold values of ∼0.3 (horizontal dashed line) to trigger intercellular calcium signaling. Note that, for experiments performed with ionomycin application, the number of responding cells also was plotted against the amplitude of [Ca2+]ichanges in cells of the first row. This corresponds exactly to the situation obtained with application of Et-1. Averaged data were obtained from a number of independent experiments ranging from 11 to 33.

