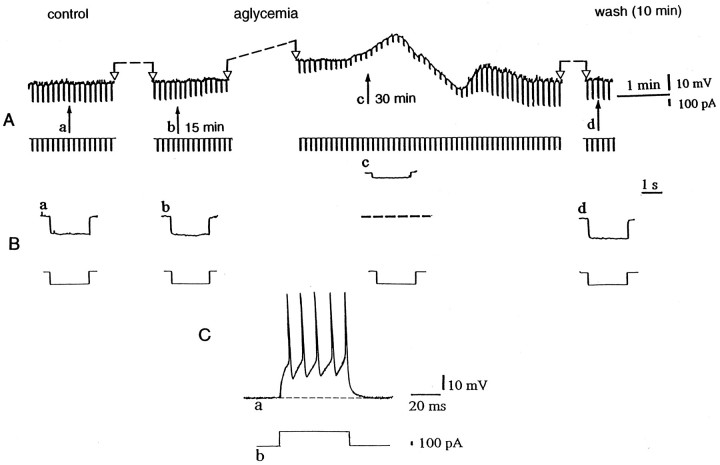
Fig. 2.
Aglycemia depolarizes striatal spiny neurons and decreases their membrane input resistance. A, Thetop part represents selected chart records of the membrane potential changes caused by glucose deprivation. Theblack arrows indicate the onset of hypoglycemia (a), 15 min of aglycemia (b), the onset of the washout (c), and 10 min of washout (d). Interruptions of the traces between two open arrows represent different periods of recording: 13 min betweena and b, 13 min between band c, and 6 min between c andd. The bottom part shows the current trace monitored during the recording. The downward voltage deflections are induced by negative current steps. B, Single sweeps recorded at higher speed at the same times as those indicated inA. Current and voltage calibrations in Aapply also for B. In Bc, thedotted line indicates the original resting membrane potential (RMP = −85 mV). C, The tonic firing discharge (a) induced by a depolarizing pulse (b) in a striatal spiny cell (RMP= −86 mV).

