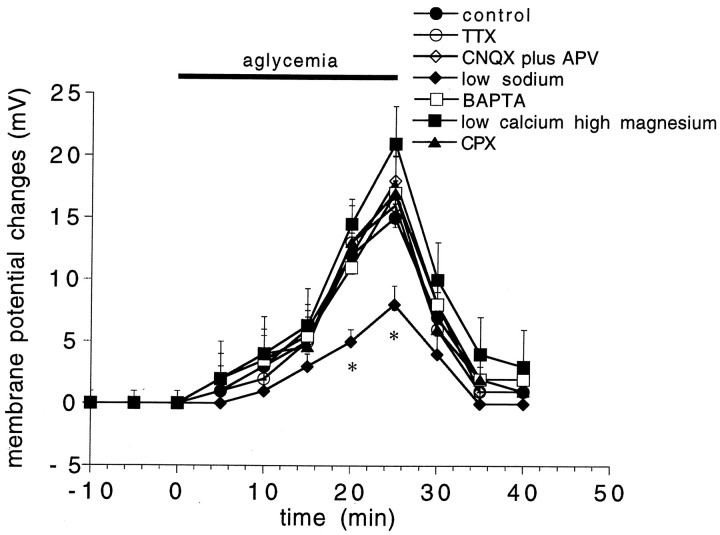
Fig. 3.
Time course of the membrane depolarization induced by aglycemia in normal medium and in different experimental conditions. The graphs show the amplitude of the membrane depolarization induced by 25 min of glucose deprivation in control medium (filled circles), in 1 μmTTX (open circles), in 10 μm CNQX plus 50 μm APV (open rhombs), in low Na+ (38 mm, filled rhombs), in the presence of BAPTA-filled electrodes (open squares), in the presence of low calcium (0.5 mm)/high magnesium (10 mm) solutions (filled squares), and in the presence of the adenosine A1 receptor antagonist CPX (300 nm; filled triangles). Each data point represents the mean of at least four single observations.Asterisks indicate significant difference from control values (p < 0.01).

