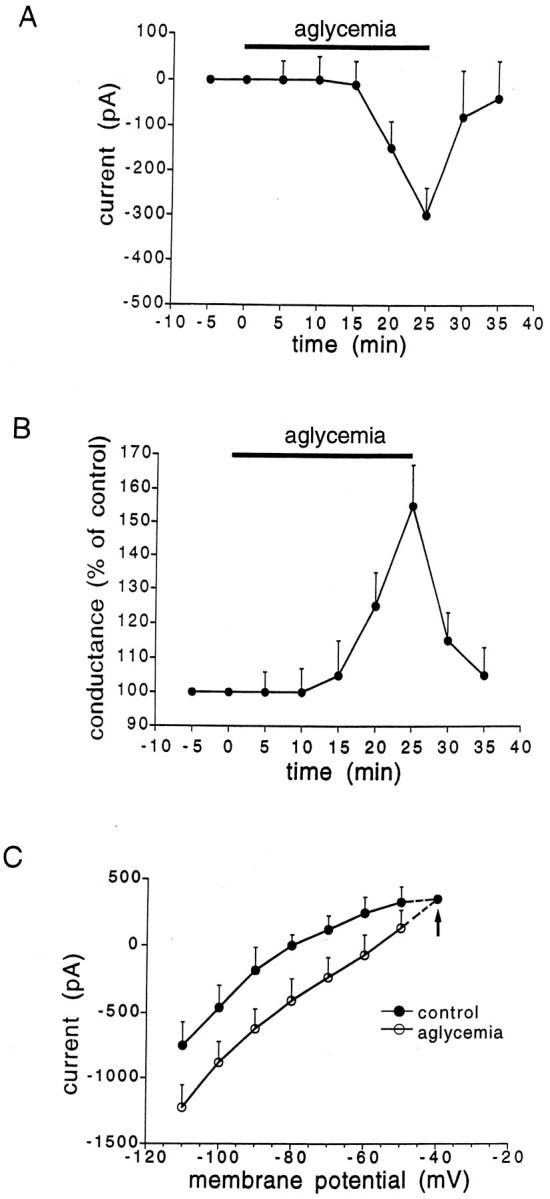
Fig. 5.

Characteristics of the inward current induced by aglycemia in spiny neurons. A, The graphshows the time course of the inward current induced by 25 min of glucose deprivation. B, The graph indicates the relative membrane conductance changes caused by 25 min of aglycemia.C, I–V relationship showing the extrapolated reversal potential (−40 mV, arrow) of the aglycemia-induced inward current. Long-lasting (1–3 sec) voltage steps were applied in both negative and positive directions before (filled circles) and during (open circles) aglycemia. The holding potential was −80 mV. Each data point represents the mean of at least four single observations.
