Fig. 4.
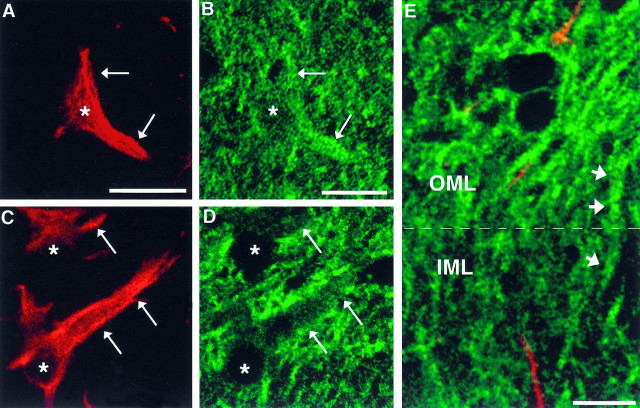
Pairs of digitized confocal microscope images taken through the OML of the contralateral (A,B) or ipsilateral (C, D) side from a rat examined 5 d postlesion showing NMDAR1-immunoreactive astrocytes identified by double-labeling immunofluorescence for GFAP (red, A,C) or NMDAR1 (green,B, D). In the contralateral OML field (A, B), the intensity of NMDAR1 immunofluorescence in the processes of astrocytes (arrows) is equivalent to, or greater than, the staining intensity of the surrounding dendrites. In contrast, in the ipsilateral (lesioned) OML field (C, D), the intensity of NMDAR1 immunofluorescence in processes of astrocytes (arrows) is much less in comparison with that of the surrounding dendrites. Asterisks denote the corresponding positions of astrocytic nuclei in each pair.E, Image showing section spanning the ipsilateral molecular layer (IML and OML) taken from the same 5 d postlesion animal. In this image, immunofluorescence for both GFAP (red) and NMDAR1 (green) is shown simultaneously. Note a greater intensity of NMDAR1 immunofluorescence in GFAP-negative processes (i.e., dendrites) in the OML compared with the IML. A single NMDAR1-labeled dendrite (arrows) can be followed continuously from the IML into the OML, where the intensity of the NMDAR1 immunofluorescence increases. Scale bar, 10 μm.

