
Fig. 7.
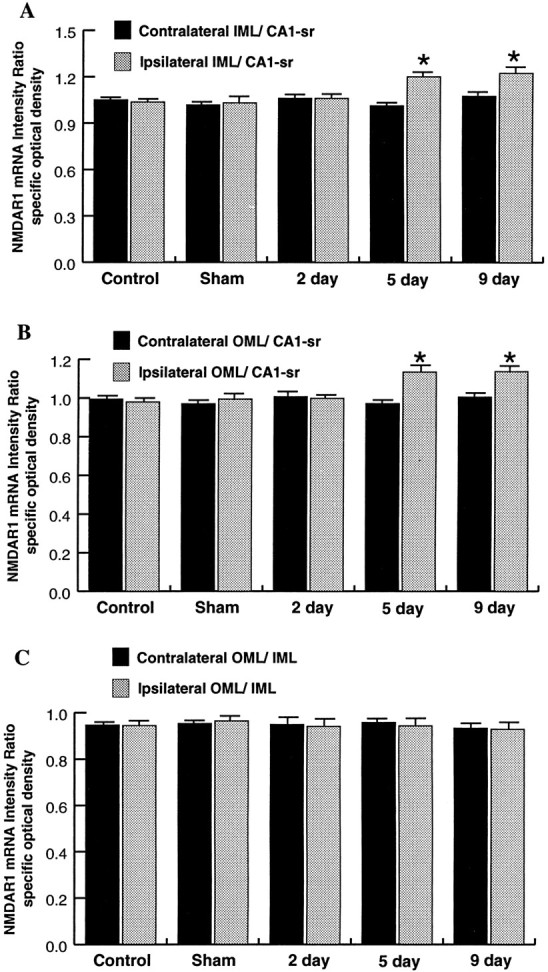
Bar graphs comparing ratios of NMDAR1 mRNA hybridization intensity values of the IML/CA1-sr (A), the OML/CA1-sr (B), and the OML/IML (C) for all control and lesioned groups. Statistical comparisons were performed both within groups (ipsilateral vs contralateral sides; Student’s unpaired t test) and across groups (ANOVA and Scheffé’s test). Comparisons of either the IML/CA1-sr (A) or the OML/CA1-sr (B) ratios showed that the ipsilateral values at 5 and 9 d (asterisks, p < 0.05) are increased compared either with the corresponding contralateral side (within-group comparisons) or with any of the ipsilateral ratios of the other groups (across-group comparisons). There were no other statistically significant differences, either between contralateral and ipsilateral sides of the same groups or for comparisons of corresponding sides across groups. Additionally, there were no statistically significant differences in the OML/IML ratios (C) in either within-group or across-group comparisons. Values represent the mean ± SEM for four rats.