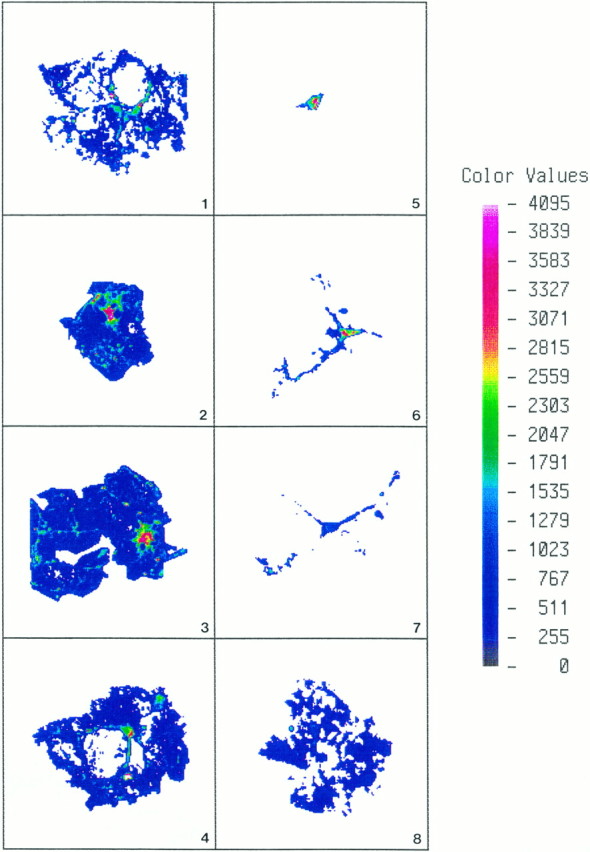
Fig. 6.

OLs immunostained for PLP in a primary culture (19 DIV) were outlined digitally with the ACAS laser cytometer, and fluorescent quantification was performed. Quantitative parameters (see Materials and Methods) for the normal cells (1–4) were standardized first, and then the same exact parameters were applied to cells (5–8) treated with antisense to PLP for 5 d, beginning at 14 DIV. Fluorescent intensity is linear (seecolor bar), with white andred the most fluorescent. Cell bodies of OLs (1–4) on the control coverslips were very brightly fluorescent, whereas their processes and large membrane sheets were less so. The intensity of pixels in the cell body versus intensity of pixels in the membrane sheet was ∼10-fold greater. The differential in fluorescent staining between cell body and sheets using PLP antibodies can be compared in Figure 5. Individual OLs in the antisense cultures (5–7) had stout and long processes but usually lacked membrane sheets; only rarely did an OL (8) in the cultures treated with antisense for 5 d have large elaborate membrane sheets that were PLP+.
