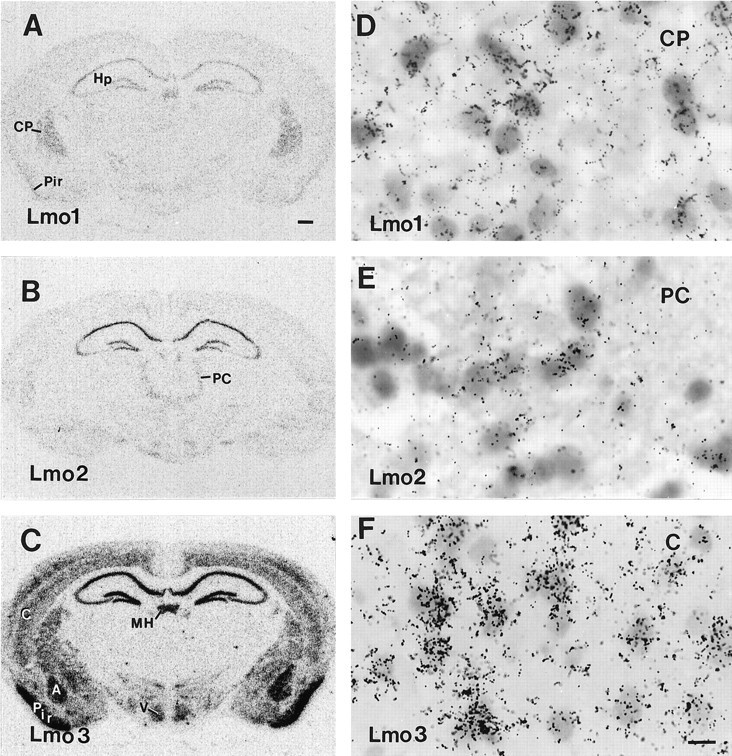
Fig. 2.

Photomicrographs showing the distribution ofLmo1 (A, D), Lmo2(B, E), and Lmo3 (C, F) mRNAs in the forebrain of untreated mice as detected by in situ hybridization with three35S-labeled oligonucleotide probes and exposure of tissue sections to radiographic film (A–C) or dipping in photographic emulsion (D–F).A–C show the different but partially overlapping patterns of labeling obtained for Lmo1,Lmo2, and Lmo3 in prominent forebrain structures. D–F show that labeling clusters over cells in the caudate putamen (D), paracentral nucleus of the thalamus (E), and layer V of parietal neocortex (F). Scale bar (shown inF): A–C, 400 μm;D–F, 12 μm. A, Basolateral nucleus of the amygdala; C, cerebral neocortex; CP, caudate putamen; Hp, hippocampal formation;MH, medial habenula; PC, paracentral nucleus of the thalamus; Pir, piriform cortex;V, ventromedial nucleus of the hypothalamus.
