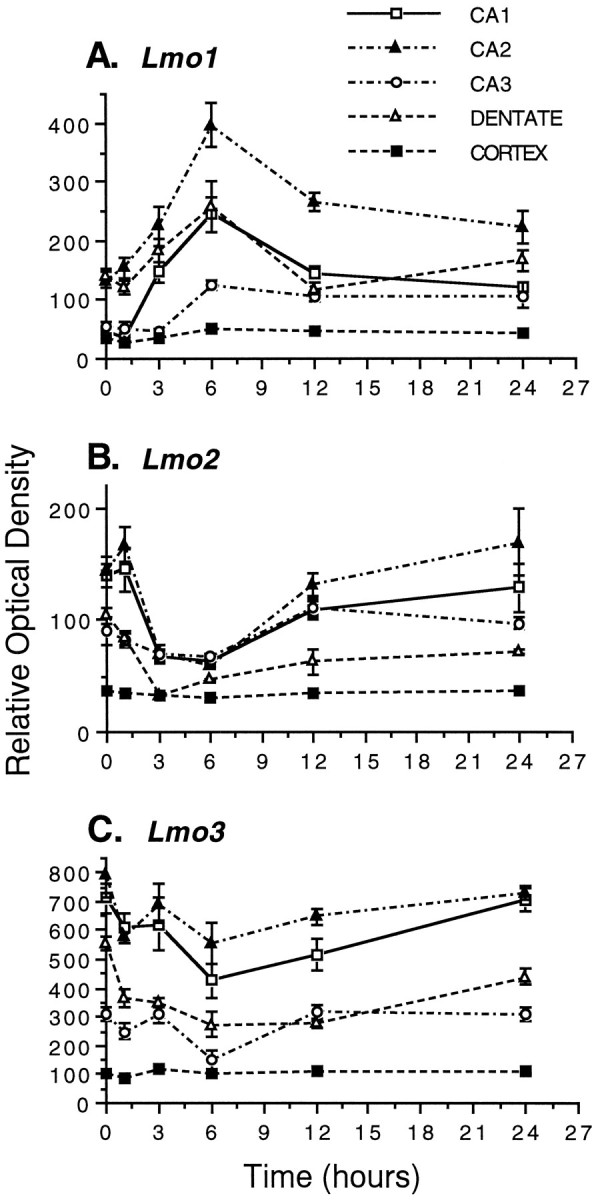
Fig. 6.

Effects of KA-induced limbic seizures on the relative mRNA levels of Lmo1 (A),Lmo2 (B), and Lmo3(C) in hippocampal subdivisions CA1, CA2, CA3, and dentate gyrus, and cerebral cortex. Mice were administered 30 mg/kg KA or saline vehicle intraperitoneally, and the levels of mRNA for the three Lmo genes were examined at 1, 3, 6, 12, and 24 hr after injection by in situ hybridization. Quantitation was performed on autoradiographs, representative examples of which are shown in Figure 7. The graphs show the ROD measurements taken from five animals with three to six measurements per animal and are expressed as the mean ± SEM. No statistically significant changes were observed at any time point for any probe in the cerebral cortex. In contrast, statistically significant changes of varying magnitude were observed for all three probes in all regions of the hippocampus, and these changes were maximal at 6 hr after onset of seizure activity.
