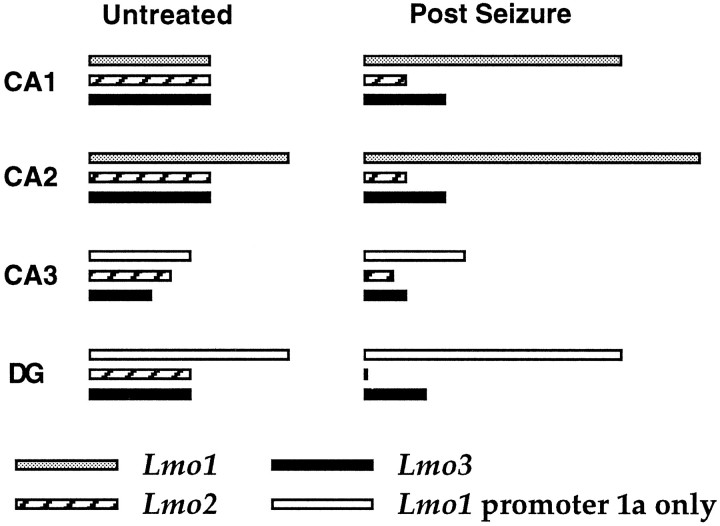
Fig. 8.
Summary diagram of relative levels of expression of Lmo1, Lmo2, and Lmo3 in different groups of hippocampal principal neurons in untreated mice and in mice after limbic seizures. The approximate differences indicated are for the expression levels of each individual Lmo gene relative to itself in the two conditions and do not reflect differences in expression between the three different genes.

