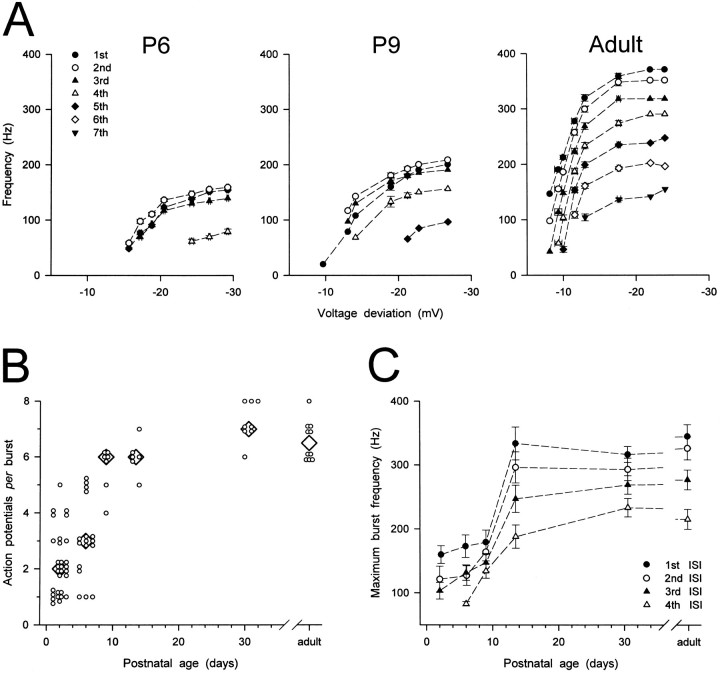
Fig. 8.
Developmental changes in the number and frequency of action potentials in a burst. A, Plots of instantaneous firing frequency versus amplitude of the preceding voltage deviation calculated from the same neurons as in Figure 7. Each point is the mean of one to eight measurements. B, Scatter plot showing age-related changes in the maximum number of action potentials per burst. Small open circlesrepresent raw data. Large diamonds represent median values. The maximum number of action potentials per burst at P1–P3 and P5–P7 was significantly smaller than in the adult (p < 0.001 for both ages).C, Plots showing age-related changes in maximum instantaneous firing frequency. Each point represents mean ± SEM (error bars) for 20, 14, 7, 6, 8, and 10 neurons at P1–P3, P5–P7, P9, P13–P14, P30–P32, and the adult, respectively. Maximum instantaneous firing frequencies at P1–P3, P5–P7, and P9 were significantly smaller than in the adult (p < 0.01 for all).

