
Fig. 6.
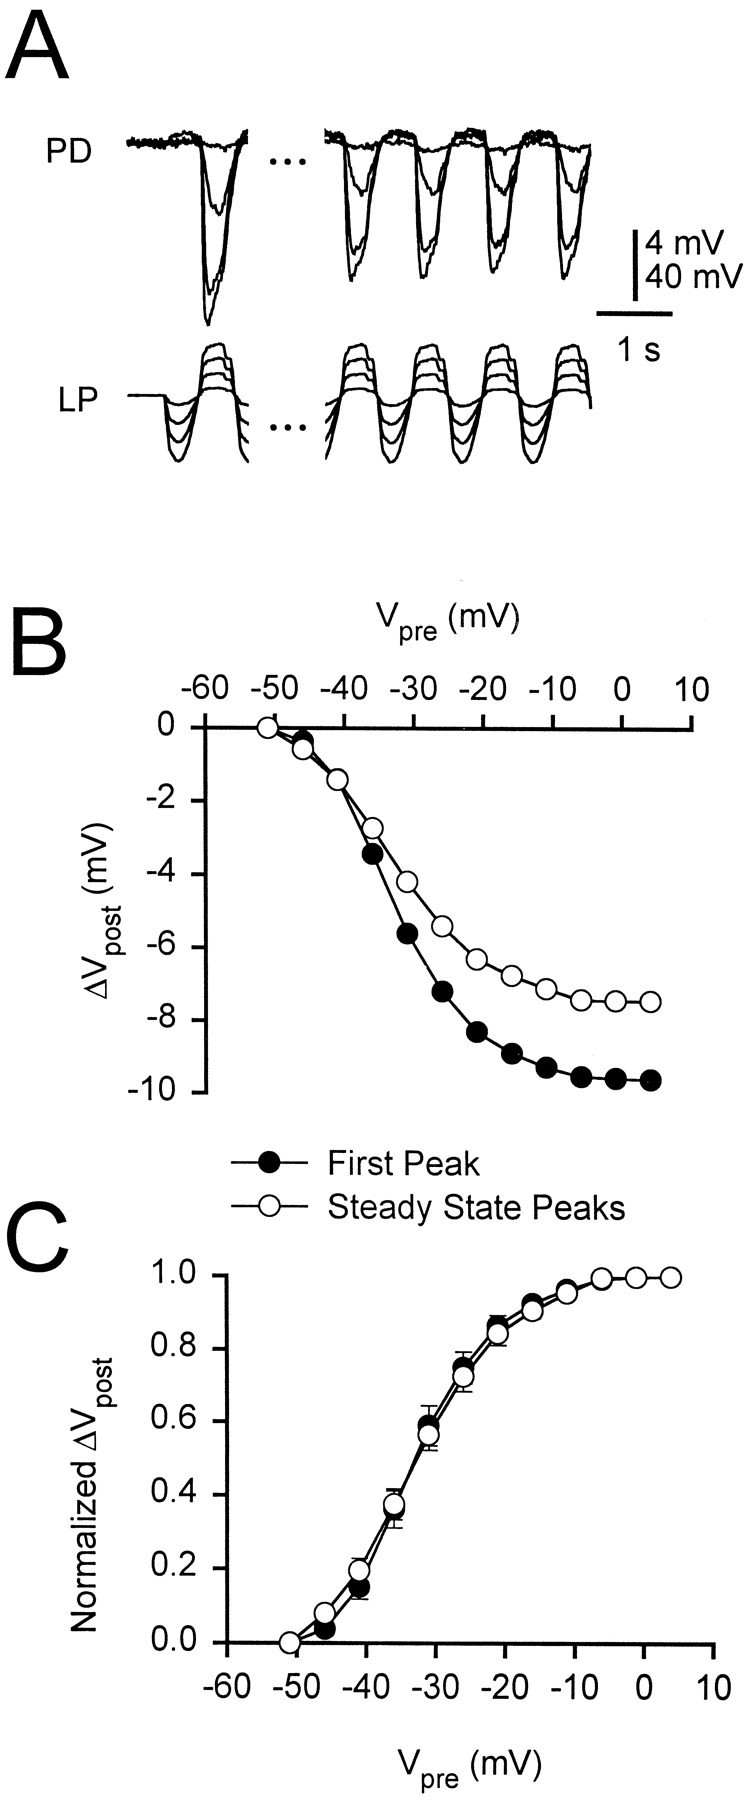
Synaptic depression does not affect the normalized I/O curve. A, Synaptic response to 1 Hz LP waveforms at different amplitudes. The responses to the first cycle (left) and the average of the last four cycles (right, defined as the steady state) of a 20 sec LP waveform are shown. The initial membrane potential of the PD neuron was 0 mV. Vertical bar, 4 mV (PD) and 40 mV (LP). B, Amplitudes of the responses to the first cycle (filled circles) and the steady state (open circles) of the 1 Hz LP waveform. C, The normalized I/O curves (mean ± SEM; n = 7) for the first cycle and the steady state of the LP waveform. The curves are not different (two-way ANOVA, p = 0.996).