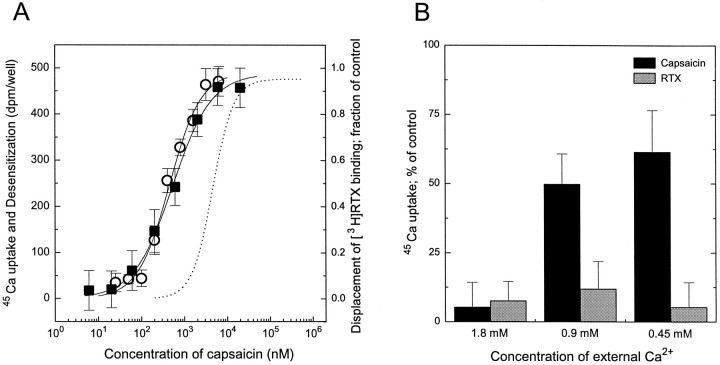
Fig. 4.
A, Comparison of dose–response curves for induction of 45Ca uptake, desensitization, and displacement of [3H]RTX binding by capsaicin in rat DRG neurons. Data are expressed as dpm/well values over baseline for capsaicin-induced 45Ca uptake (○). In the case of desensitization (▪), cells were pretreated with different concentrations of capsaicin for 6 hr and then challenged with 3 μm capsaicin. Desensitization was defined as the difference (in dpm/well) in 45Ca uptake between pretreated and control cells challenged with capsaicin. For comparison, the capsaicin dose–response curve for displacement of [3H]RTX binding (dotted line), determined previously by us (Acs et al., 1996), was plotted. Points represent mean values from sets of eight determinations in a single experiment; error bars indicate SEM. The theoretical curves were calculated by fitting the measured values to the Hill equation. Two additional experiments in each case yielded similar results.B, Extracellular Ca2+ dependence of the capsaicin-induced desensitization of rat DRG neurons. Cells were incubated with either 250 pm RTX or 1 μmcapsaicin for 4 hr in medium that contained 1.8 mm, 0.9 mm, or 0.45 mm Ca2+. After incubation, cells were washed with serum-free DMEM containing 1.8 mm Ca2+ and challenged with 3 μm capsaicin to induce 45Ca uptake. Data were expressed as percentage values of control 45Ca uptake determined on untreated cells in the same medium. The external Ca2+ dependence of desensitization is indicated by the return of the 45Ca uptake response. Points represent mean values from sets of eight determinations in a single experiment; error bars indicate SEM. Two additional experiments yielded similar results.

