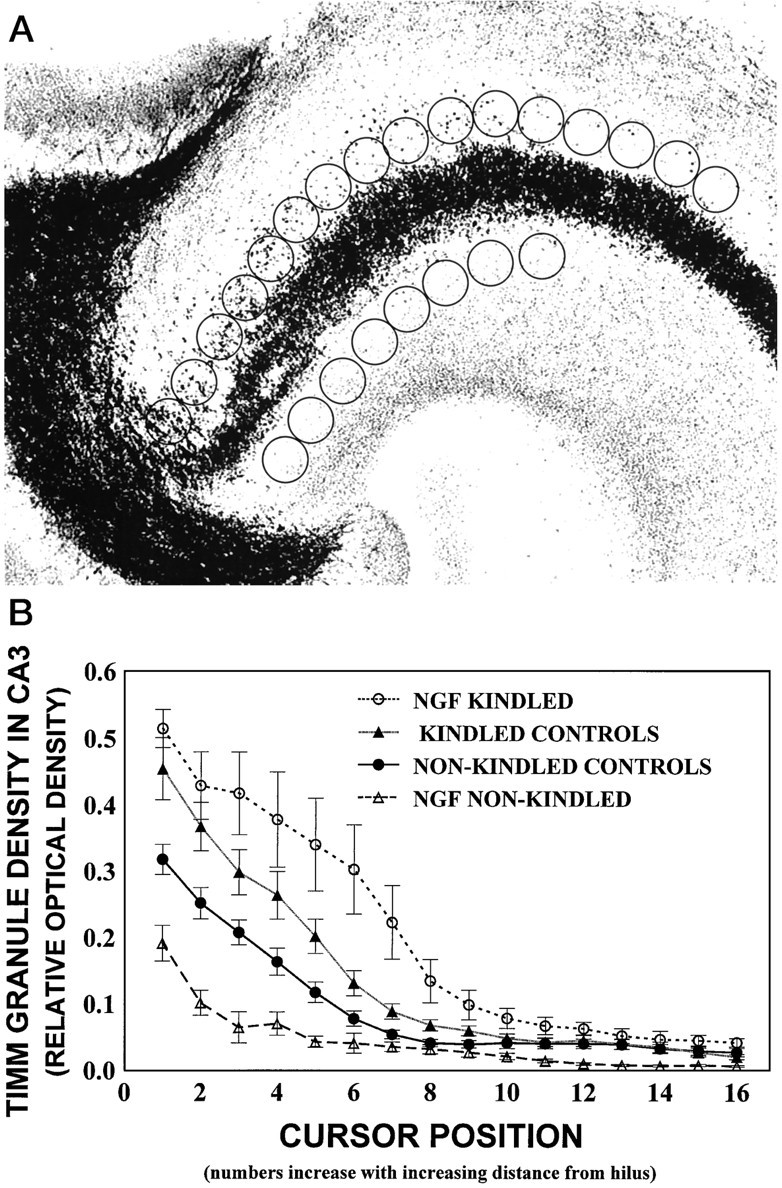
Fig. 3.

A, Digitized image of the hippocampal CA3 region. The density measurements of Timm granules were performed by placing an open circle cursor (1.3 cm2) at 16 adjacent positions along the stratum oriens starting adjacent to the hilar region. Eight cursors were placed in the stratum radiatum adjacent to the hilar region and provided the background staining density. Note that cursor windows for background measures in the stratum radiatum were clearly out of the mossy fiber tracts. B, Timm granule density in the CA3 region expressed as relative optical density (ROD) as a function of cursor position for all groups. Nonkindled and kindled control groups contain combined data for cytochrome C and PBS groups, because no differences were found among these groups by a three-way ANOVA and subsequentpost hoc comparisons (p > 0.05). Similarly, no differences in Timm granule density from ipsilateral and contralateral hippocampi were found (p > 0.05), so data were combined for graphical presentation. Values represent mean ROD as a function of cursor position ± SEM for the NGF-kindled group (n = 7), kindled control group (PBS-infused,n = 6; cytochrome C-infused, n= 5), nonkindled control group (PBS-infused, n = 7; cytochrome C-infused, n = 6), and NGF-infused nonkindled group (n = 5). There was a main effect for Cursor Position (p < 0.001), showing that the density of Timm granules was greatest in the hippocampal CA3 area near the hilus and decreased with increasing distance from the hilus in all animals. This main effect was qualified further by a significant Group × Cursor Position interaction (p < 0.001). Post hocanalyses revealed that Timm granule density was increased in the kindled groups (upper curves), as compared with all nonkindled groups (lower curves; p< 0.05). This enhancement was increased further in the NGF-kindled group (topmost curve), as compared with the other kindled conditions (p < 0.05).
