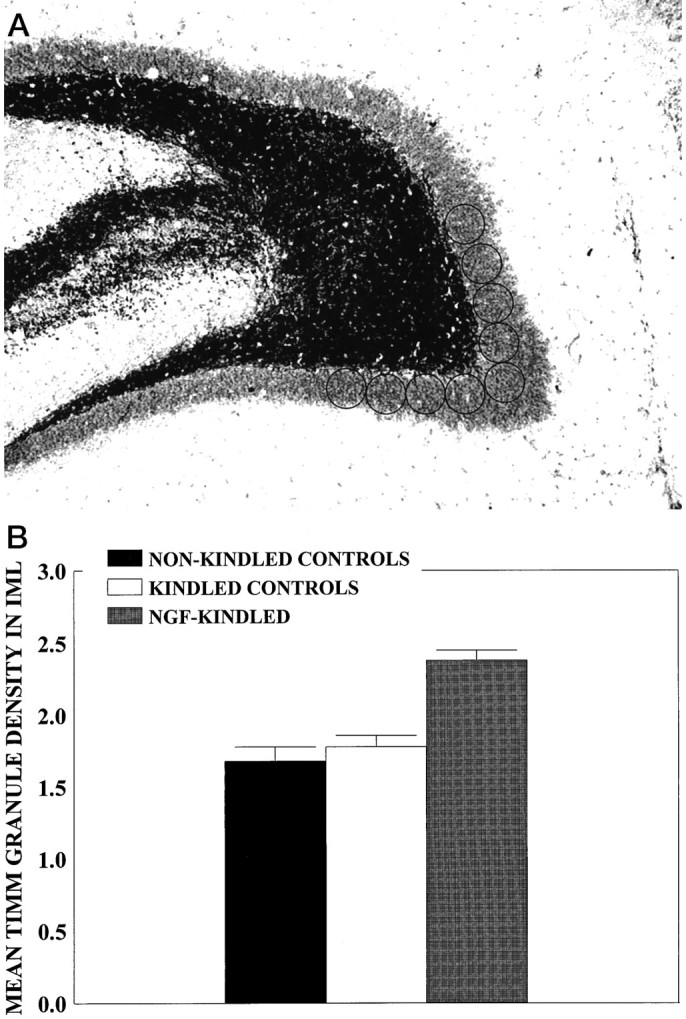
Fig. 5.

A, Digitized image of the IML region. Density of Timm granules in IML region was measured at nine adjacent cursor positions by placing one cursor above the genu of the hilus and four cursor positions to the right and left of this cursor. Background values were provided as described in Figure3A. B, Timm granule density in IML region expressed as ROD for kindled-infused controls (n = 11), nonkindled-infused controls (n = 18), and the NGF-infused kindled group (n = 6). Timm granule density was increased in the NGF-kindled group relative to the kindled control group (p < 0.05) and the nonkindled group (p < 0.01). Values represent mean Timm granule density (ROD) as a function of group ± SEM.
