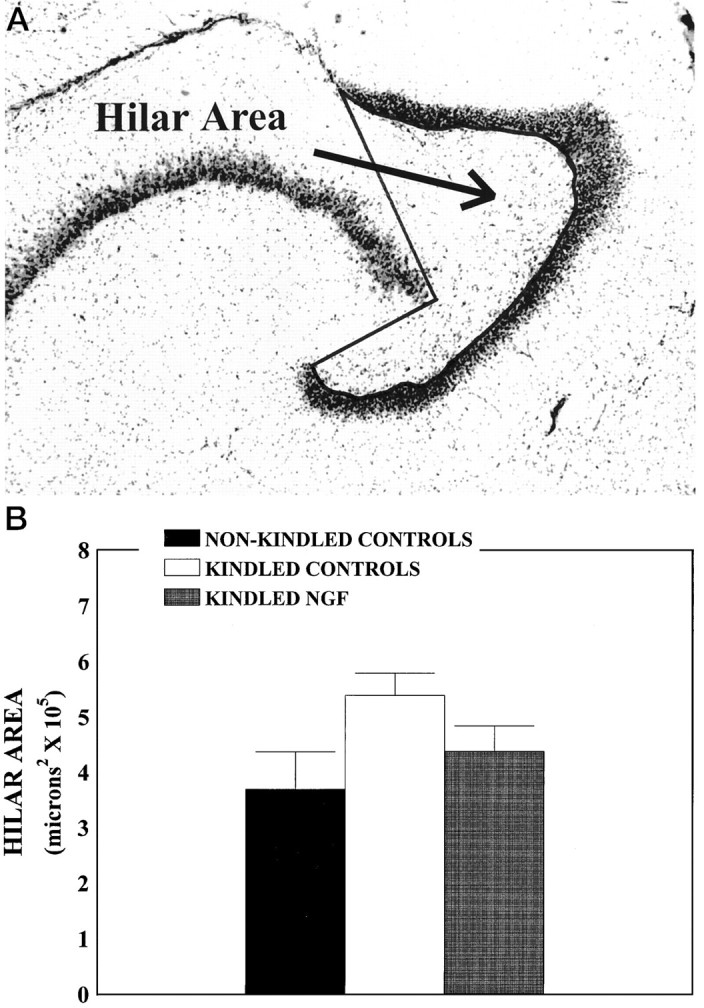
Fig. 7.

Hilar area measurements. A,Hilar area outlined by thick line, using the MCID image analysis system. Hilar area was defined by the inner edge of the granule cell layer and the lines connecting the tips of the two granule cell blades to the beginning of the pyramidal cell layer of Ammon’s horn. Cresyl violet-stained sections used for the determination of neuronal density also were used for hilar area measurements.B, Mean hilar area as a function of treatment condition. A three-way ANOVA and subsequent post hoc comparisons revealed no differences among the nonkindled PBS (n= 7), cytochrome C (n = 6), and NGF groups (n = 5, nonkindled controls) (p > 0.05) and no differences between the kindled PBS (n = 6) and cytochrome C (n = 5) groups (kindled controls) (p > 0.05). Data for these nonkindled and kindled animals were combined, respectively. Values represent mean hilar area expressed in μm2 ± SEM. Mean hilar cell area was increased by ∼15% in the kindled control group relative to the nonkindled animals and the kindled NGF group (n = 7; p < 0.05).
