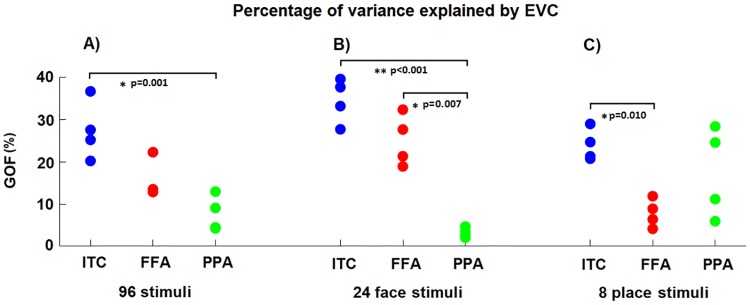
Fig 4. The goodness-of-fit (GOF) values for all the subjects and sets of stimuli.
A), B) and C) The percentages of GOF by using the linear pattern transformations from EVC to the three output ROIs for all 96 stimuli, the 24 face stimuli and the 8 place stimuli, respectively. The p-values for the paired t-tests are reported even if based on only four subjects.

