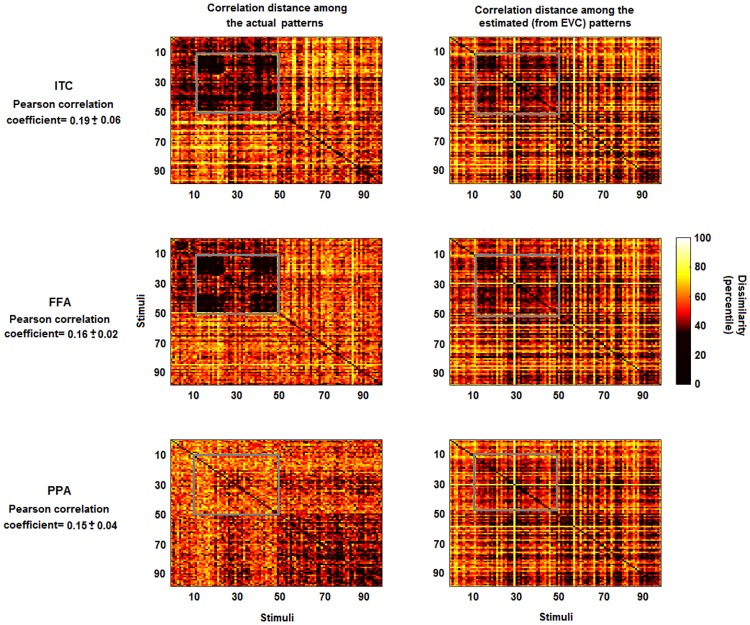
Fig 5. Representational dissimilarity matrices for actual and estimated patterns.
Left panels: percentile of the dissimilarity (correlation distance) among the multivariate patterns of the actual ITC, FFA and PPA. Right panels: percentile of the correlation distance among the estimated patterns from EVC. The estimates of the multivariate patterns were obtained by using the pattern transformation between EVC and ITC, FFA and PPA. While some information is lost, some characteristic patterns which are visible in the left panels (e.g. the patterns highlighted by the grey boxes for ITC and FFA) are also visible in the right panels. The average correlation coefficients between the lower triangular portions of the representational dissimilarity matrices (i.e. the linearly predicted representational dissimilarity values) are 0.19, 0.16 and 0.15 (all p-values<0.001).

