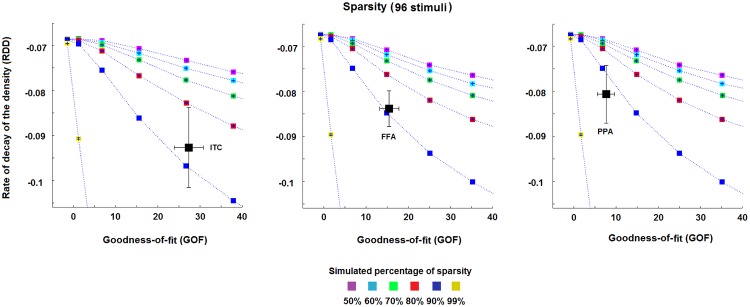
Fig 6. Estimated sparsity for the pattern transformation.
The three panels show the estimates of the percentage of sparsity for the pattern transformations EVC->ITC, EVC->FFA and EVC->PPA, respectively. The dotted lines represent the mean RDD and GOF values across the simulation-realisations for each of the simulated percentages of sparsity, i.e. 50%, 60%, 70%, 80%, 90% and 99%. Each area between two dotted lines thus represents a fixed range for the percentage of sparsity, e.g. the area between the two curves associated with the blues and red squares denotes a degree of sparsity between 80% and 90%. The black squares (and their error bars) in the panels denote the mean (and the standard error of the mean) estimate of RDD and GOF across the four subjects. All estimates show a high percentage of sparsity for all transformations (>80%). Slightly higher percentages are shown by the transformations EVC->FFA and EVC->PPA.

