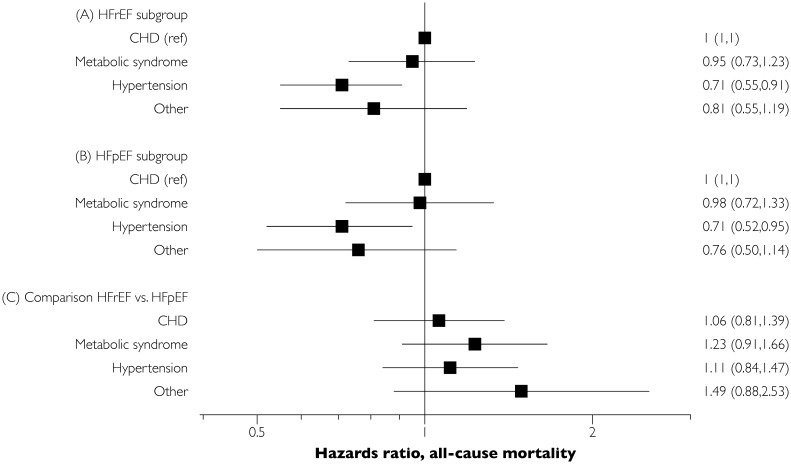
Fig 2. Hazards ratio associated with various subphenotypes for all-cause mortality.
Panel A refers to the results from a Cox model including only HFrEF patients, the CHD subgroup served as the referent. Similar, panel B illustrates to the results from a sub-analysis including only HFpEF patients. The panel C shows within each subgroup comparison of mortality risk in HFpEF vs. HFrEF.

