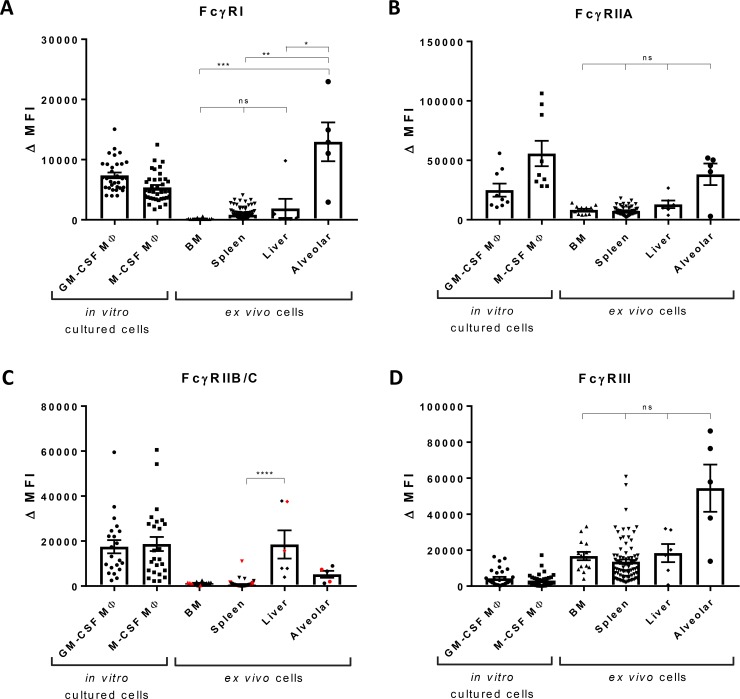
Fig 4. FcγR expression by macrophages from different tissues.
Expression of (A) FcγRI, (B) FcγRIIA (MoAb IV.3), (C) FcγRIIB/C (MoAb 2B6), individuals encoding FCGR2C-ORF are indicated in red, and (D) FcγRIII by monocyte-derived macrophages cultured in the presence of GM-CSF, n = 9–32, and M-CSF, n = 9–39, by bone marrow macrophages, n = 14, red pulp macrophages, n = 83, Kupffer cells, n = 5, and alveolar macrophages, n = 5, determined by flow cytometry. For the cultured macrophages, individuals encoding FCGR2C-ORF were excluded from analysis. Data shown are median fluorescence intensity, corrected for the proper isotype control. For FcγRIIB/C expression, the levels on BM macrophages versus Kupffer cells from liver were nearly significant, p = 0.058. *p < 0.05, **p < 0.01, ***p < 0.001, ****p < 0.0001, ns = not significant.

