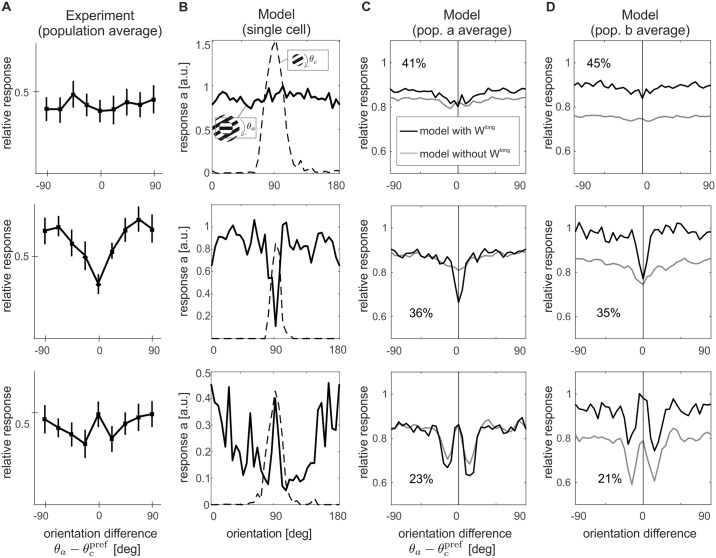
Fig 5. Orientation-contrast modulations.
A center stimulus with preferred orientation is combined with an annulus of varying orientations (see icons in column (B)). (A) In experiments three response patterns are observed, namely, from top to bottom, untuned suppression, iso-orientation suppression and iso-orientation release from suppression (data replotted from [4]). The model reproduces these three response patterns both at the single cell level (B) and at the population level for a (C) and b (D). For comparison, orientation tuning for a center-alone stimulus is shown by the dashed line in (B). In (C, D), the gray lines display orientation-contrast tuning of the same ensembles without long-range interactions. Note that in (A) and (C, D), responses are shown normalized by the response to the center alone at the preferred orientations of the units. Percentages indicate the proportion of cells that fall in the same orientation-modulation class.

