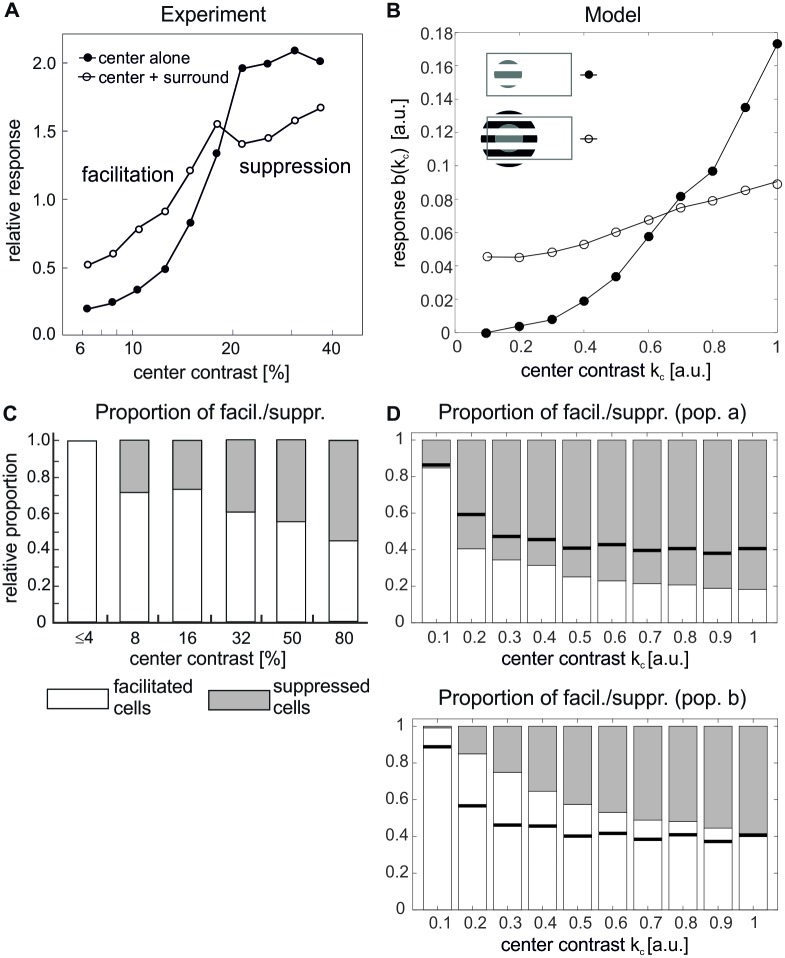
Fig 6. Luminance contrast tuning.
(A, B) Single-cell responses to a center stimulus of varying contrast without flanking surround stimuli (filled circles) are compared to responses to the same center stimulus combined with high-contrast flanking surround stimuli of the same preferred orientation (open circles) in experiment (A) (redrawn from [6]) and model (B). The stimulus configurations are indicated inside the graphs. (C, D) Population statistics, detailing the proportion of cells showing facilitation (light bars) or suppression (gray bars) in dependence on center stimulus contrast. Experimental data in (C) is redrawn from [6]. In the model (D), cells were judged to be significantly facilitated (suppressed) if their activation ratio between center-surround and center alone stimulation bsur(kc)/bcen(kc) at contrast kc was larger than 1 + ε (smaller than 1 − ε), with ε = 0.01. Solid black lines indicate proportion of cells showing facilitation without long-range interactions. The top plot in (D) shows the statistics for population a and the bottom plot for populations b.

