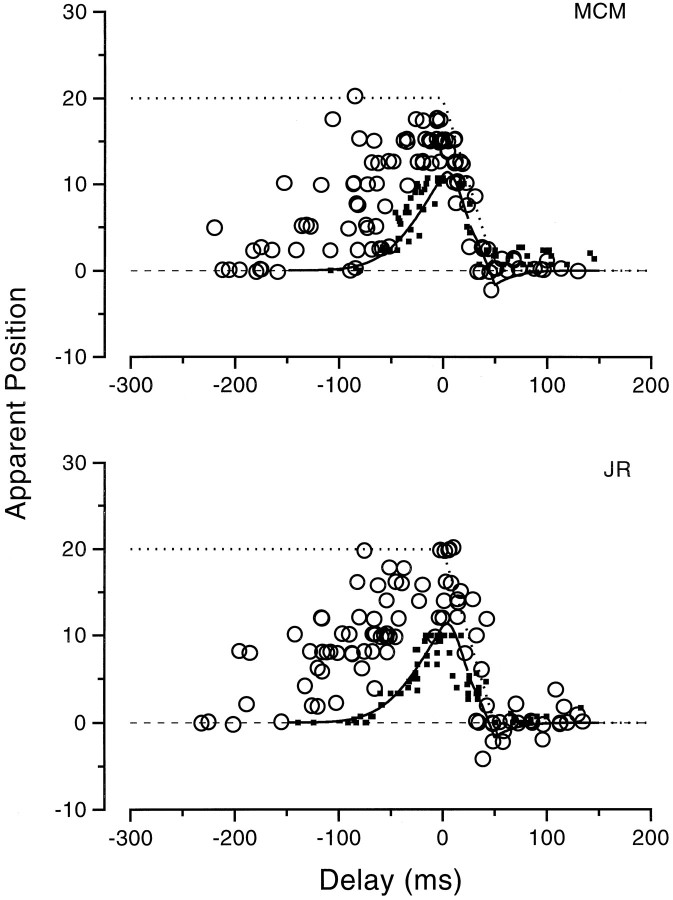
Fig. 10.
Apparent position of bars before, during and after simulated saccades, produced by displacing the image 20° rightward at saccadic speeds. The results are shown by the large open circles. The small squares show the results during saccades (replotted from Figs. 2, 3) for comparison. Thedotted line shows the physical displacement of the bar caused by the mirror.

