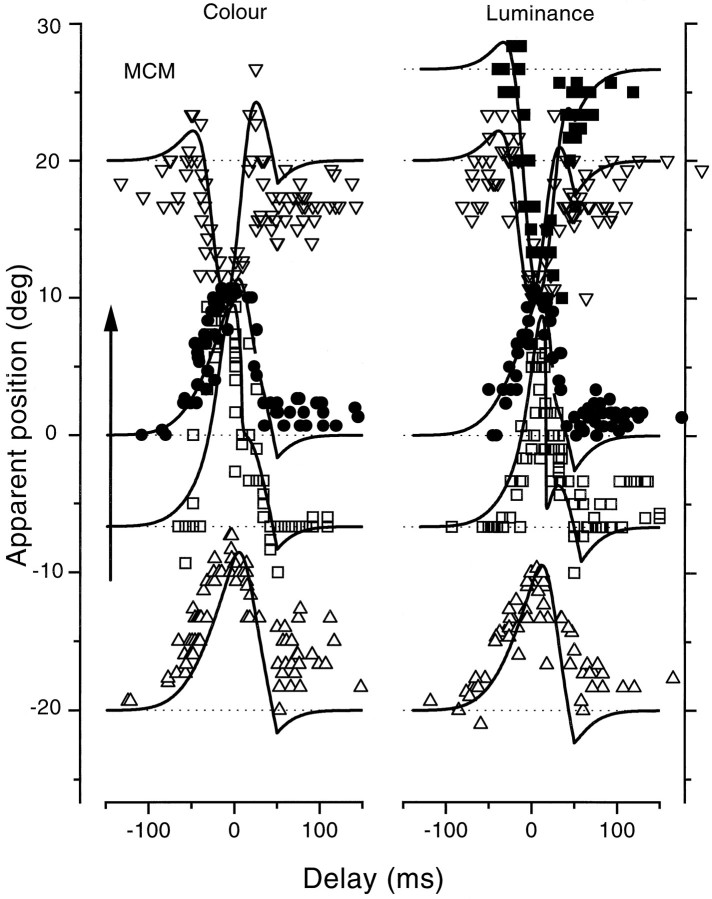
Fig. 2.
Apparent position of a bar flashed briefly (8 msec) at various positions and at various (randomized) times relative to saccadic onset, as observers saccaded from the fixation point at −10° to the target at 10° (indicated by the arrowon the left). For the curves on theleft, the bars were green, equiluminant with the red background, and for those on the right they were black. All of the data are from observer M.C.M., an author. Thecontinuous curves are the predictions of the model, described in Mathematical Model of the Results. The physical position of the bar was −20° (upright triangles), −7° (open squares), 0° (filled circles), 20° (inverted triangles), or 28° (filled squares). The pattern of results for the dark bars was very similar to that with the equiluminant bars. Bars displayed to the left of the saccadic target were mislocalized in the direction of the saccade, with maximum error just before saccadic onset; bars displayed past the target were mislocalized in the other direction, toward the target.

