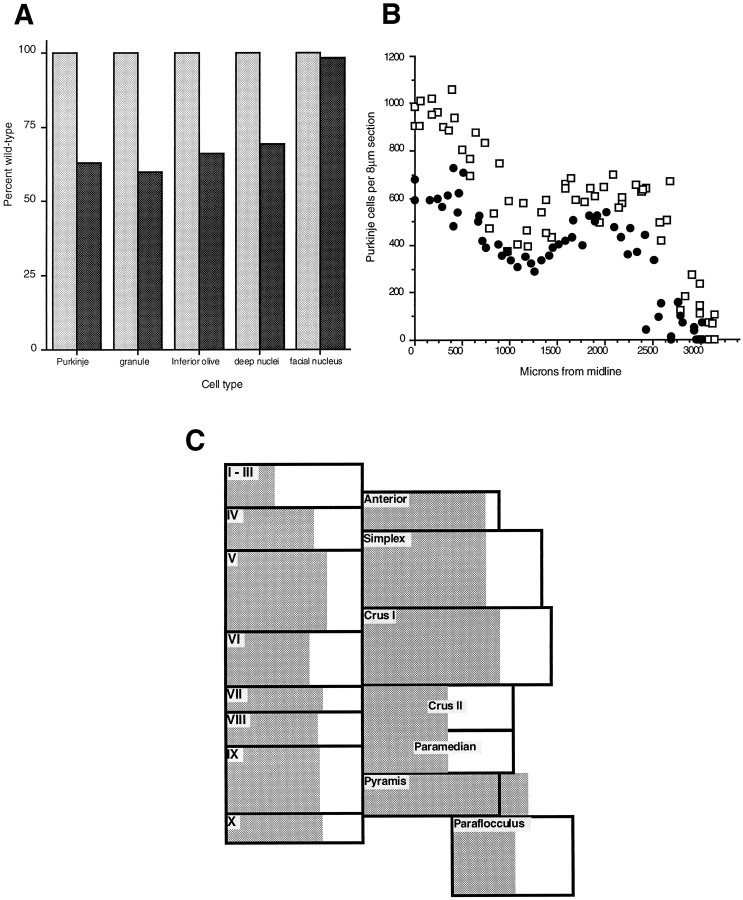
Fig. 6.
A, Effect ofEngrailed-2 on neuronal cell number. The percentage of each cell type in wild-type (shaded bar, 100%) and affected (solid bar) animals is shown. All of the principal neurons of the olivocerebellar circuit are affected to about the same extent. Counts of the motor neurons of the facial nucleus serve as a control, indicating that the deficit is specific for the cell types shown. B, Uniform reduction of Purkinje cell number. The raw counts from hemicerebella of mutant and control animals are shown graphically (□, wild-type; •, En-2hd/hd). That the overall shapes of the curves are nearly identical indicates the lack of regional variation in the Purkinje cell loss observed in the mutant. C, Purkinje cell loss in theEn-2 mutant cerebellum. In this diagram, Purkinje cell counts are displayed folium by folium. Each box is proportional in area to the number of Purkinje cells in the corresponding folium. The shaded region represents the the number of Purkinje cells found in each folium in theEn-2 mutant. In each case, about two-thirds of the box is shaded, indicating an approximate one-third loss of cells. This loss appears uniform, because it is not greater or lesser in any given folium.

