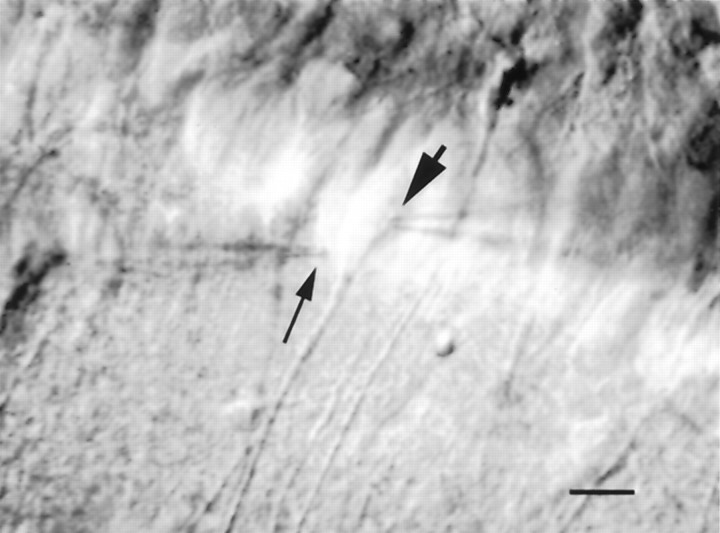
Fig. 2.
Local drug application protocol. This photomicrograph shows the relative positioning of the patch recording electrode (large arrow) and the drug application pipette (small arrow) during recording from a CA1 pyramidal neuron. After the initiation of whole-cell recording, the drug application pipette was lowered through the tissue under visual control while periodically testing for adenosine responses. Adenosine and adenine nucleotides were ejected by applying brief pressure pulses to the drug application pipette (typically 10 psi/10 msec). Responses could be obtained when the drug pipette was in close proximity to the neuron (2–10 μm), but they were generally undetectable when the pipette was moved farther than 20 μm from the cell being tested. Stable responses could be evoked with this protocol at 30 sec intervals for periods >2 hr. Despite the proximity of the drug pipette to the cell, pressure ejection artifacts were rarely encountered. Scale bar, 13 μm.

