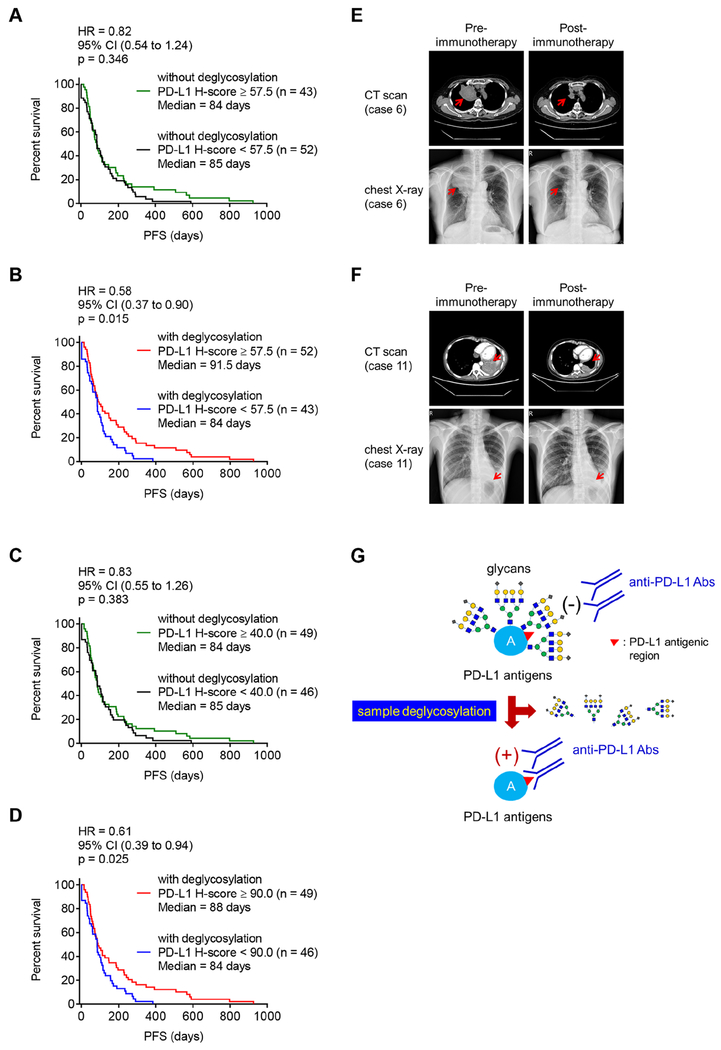
Figure 5. Deglycosylation improves predictive ability of PD-L1 as a biomarker for immunotherapy.
(A and B) The PFS of cancer patient samples processed without (A) or with (B) deglycosylation by PNGase F (5%) pretreatment. Cases with H-score equal to or higher than the median value of total 95 cases (H-score = 57.5) were considered as high expression and those with H-score less than the median value as low expression.
(C and D) The PFS of cancer patient samples processed without (C) or with (D) deglycosylation by PNGase F (5%) pretreatment. Cases with H-score equal to or higher than the median value of individual group [H-score = 40 in the group of without glycosylation (C) and H-score = 90 in the group of with glycosylation (D), respectively] were considered as high expression and those with H-score less than the respective median value as low expression.
(E and F) Representative images of computed tomography (CT) scan and chest X-ray from case 6 (E) and case 11 (F) from Figure 3A, pre- and post-anti-PD-1 (nivolumab) immunotherapy.
(G) A proposed model of PD-L1 antigen retrieval through sample deglycosylation. In brief, the glycan structure of PD-L1 hinders antibody-based detection targeting the PD-L1 antigen. Sample deglycosylation more accurately assesses PD-L1 expression to allow better estimation of PD-L1 levels to prevent false-negative readouts in clinical settings.
(A–D) Cohort size for each group is indicated. p values were determined by Log-rank (Mantel-Cox) test. Hazard Ratio (HR) and 95% confidence interval (CI) were determined by Mantel-Haenszel method.
See also Figure S5.

