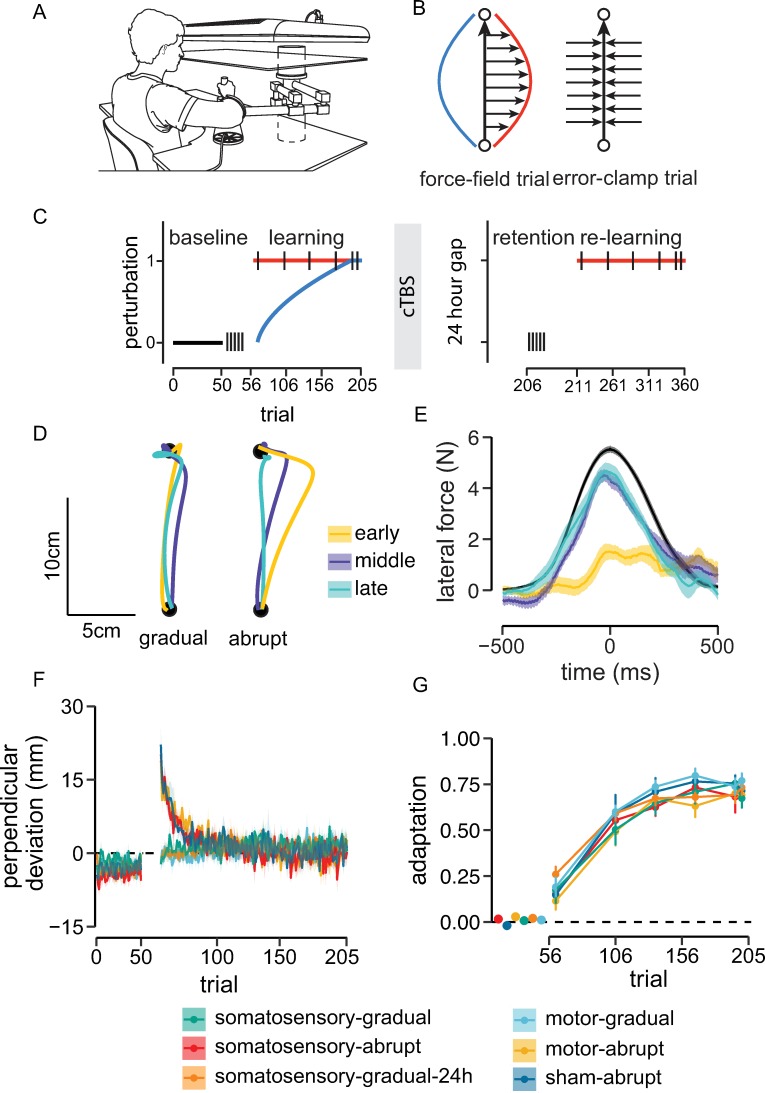
Fig 1. Experimental procedure and learning performance during day 1 training.
(A) Sketch of the setup used to display the start and target positions, and a participant holding the robotic manipulandum. Sketch is adapted from van Vugt and colleagues [36]. (B) Schematic of force-field and error-clamp trials. The red curve exemplifies the force applied by the robot arm, and the blue curve illustrates the ideal compensatory force profile. In error-clamp trials, the robot constrained the hand movement to a straight line to the target. Forces applied to the channel walls serve a measure of learning and retention. (C) Schematic of various phases of the experimental procedure. Participants in somatosensory-gradual, motor-gradual, and somatosensory-gradual-24h groups trained with a gradually introduced force field on day 1 (blue). Participants in the somatosensory-abrupt, motor-gradual, and sham-abrupt groups trained with an abruptly introduced force field on day 1 (red). Relearning on day 2 involved an abruptly introduced perturbation for all the groups. Black vertical bars represent the position of error-clamp trials. (D) Representative hand paths in early (yellow), middle (violet), and late (magenta) phases of adaptation to a gradual and abrupt perturbation. (E) Lateral force profiles produced by participants in different phases (early, middle, late) of the initial training session. The force profile in black represents the averaged ideal force profile needed to completely compensate for the applied perturbation. (F) Learning curves showing mean PD across trials for each experimental condition. All the groups reached similar performance levels by the end of the initial training session, and PDs were close to zero. (G) Change in the adaptation coefficient during learning (linear regression of the ideal force onto the actual force during error-clamp trials). Each group reached similar adaptation levels by the end of training. Shaded regions and error bars represent ±SEM across participants. Data used to generate the figures in (E), (F), and (G) can be found in S1 Data. cTBS, continuous theta-burst transcranial magnetic stimulation; PD, perpendicular deviation.

