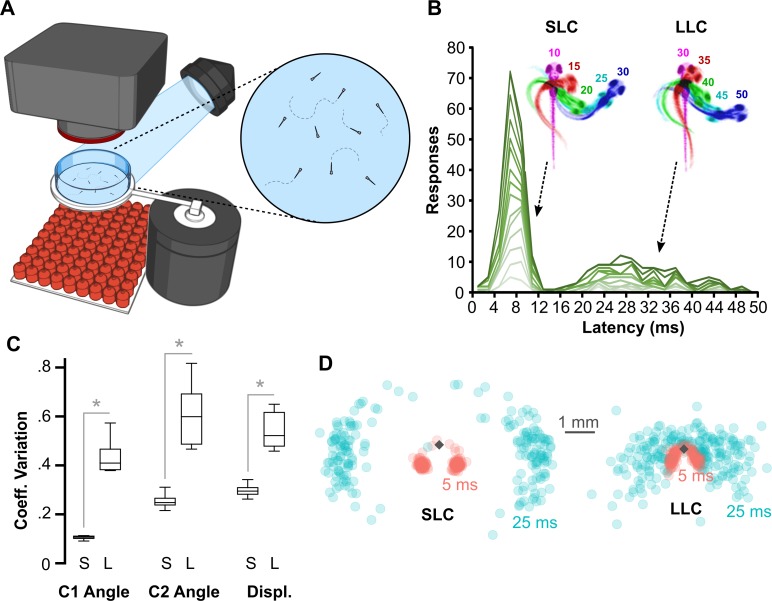
Fig 1. Ballistic and delayed escape reactions performed by larval zebrafish.
(A) Schematic of behavioral experiments in free-swimming larvae: groups of 15–20 6-dpf larvae were imaged from above at 1,000 frames per second with a high-speed camera. An infrared LED array below provided illumination. Nondirectional acoustic/vibratory stimuli were delivered to the arena by a minishaker. (B) Frequency histogram of response latencies for individual larvae (n = 15). Inset: Time-lapse images of initial C-bend for larvae performing an SLC or an LLC, color-coded by millisecond poststimulus. (C) Coefficient of variation (“Coeff. Variation”) for the initial bend angle (“C1”), counterbend angle (“C2”), and net displacement (“Displ.”) for SLC (“S”) and LLC (“L”) responses. n = 16 groups of larvae. *p < 0.001, paired t test. (D) Spatial distribution of head locations 5 ms (red) and 25 ms (blue) after escape initiation for SLC (n = 199) and LLC (n = 220) reactions, relative to initial position (diamond). Underlying numerical data are included in S1 Data. dpf, day post-fertilization; LED, light-emitting diode; LLC, long-latency C-start; SLC, short-latency C-start.

