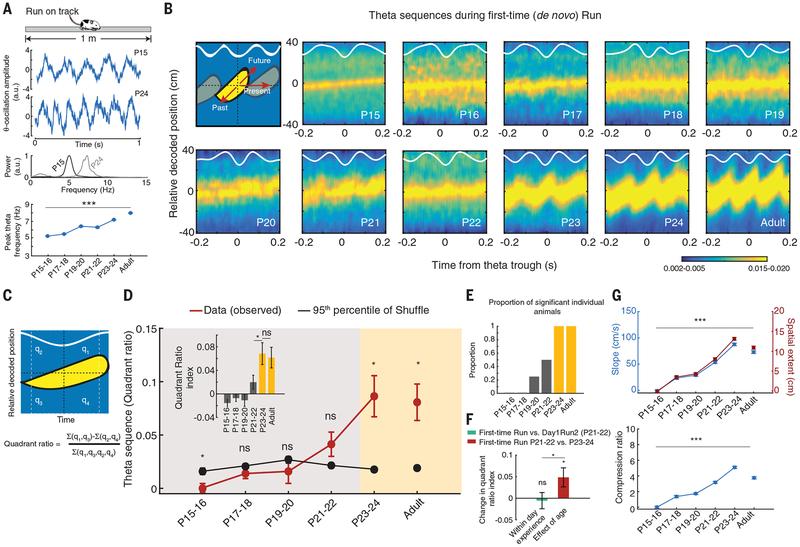
Fig. 2. Delayed development of compressed theta sequences during first-time navigation on linear tracks.
(A) Age-dependent increase in CA1 theta oscillation frequency across development (P < 10−10, ANOVA). The middle and bottom panels show wide band signals and the normalized power spectra for example P15 and P24 animals during the run. (B) Examples of developmental timeline (P15 to P24, panels 2 to 11) for compressed theta sequences binding past, current, and future locations (cartoon at top left). White curves: session-averaged theta oscillations. Note the absence of compressed theta rhythmic binding of past, current, and future locations at younger ages. (C) Quantification method for compressed theta sequence strength (quadrant ratio) in binding past, current, and future locations. (D) Developmental timeline (P15 to P24) of theta sequence strength. Note the emergence of consistent adult-like theta sequences (>shuffle) at P23–P24 (two directions per animal; n = 5, 3, 4, 4, 3, and 3 animals per age group, from P15–P16 to adult). (Inset) The quadrant ratio index significantly increases with age and becomes adult-like at P23–24. (E) Proportion of animals within age groups with theta sequences above the 95th percentile of their shuffles. (F) Effects of navigational experience on theta sequence strength (quadrant ratio index). Note that within-day experience (green bar; P = 0.75, paired t test, two directions per animal, three animals) does not reveal significant increases in theta sequence strength at P21–P22, while the increase in age, from P21–P22 to P23–P24, reveals increased strength during first-time navigation (red bar; P = 0.04, t test, two directions per animal, n = 4 and 3 animals). The effect of age is significantly higher than that of within-day experience (P = 0.03, t test). (G) Theta sequence slope/spatial extent (top) and compression ratio (bottom) increase with age (P < 10−10, ANOVAs). Data are means ± SEM. ***P < 10−10; *P < 0.05; ns, not significant.

