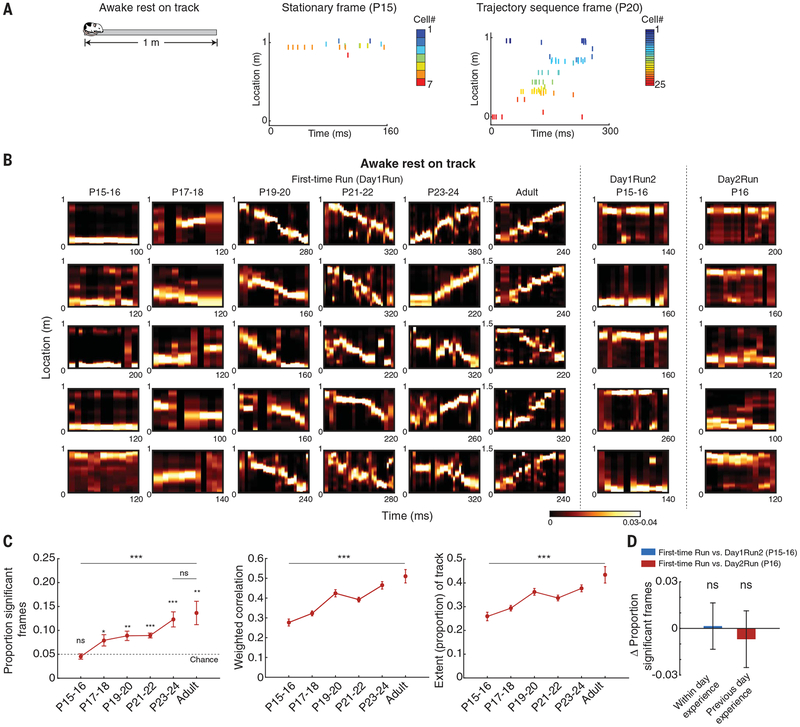
Fig. 3. Developmental timeline for trajectory-depicting sequences during on-track awake rest epochs.
(A) Neuronal ensemble activity during rest within first-time navigation (left panel) depicts individual locations at P15–P16 (stationary ensembles in frames, middle panel) and entire trajectories from P19–P20 (right panel). (B) Examples of stationary location-depicting frames and partial and entire trajectory–depicting frames across age groups during on-track rest epochs for first-time navigation (Day1Run, left 30 panels), within-day runs on same track (Day1Run2, middle 5 panels), and Day2Run on the same track (right 5 panels). Bayesian decoding analysis was used. (C) Age-dependent increases in proportion of significant trajectory-depicting frames (left; P < 10−4, ANOVA), correlation strength (middle; P < 10−10), and extent of depicted trajectory (right; P < 10−6). (D) Within-day (P = 0.92, paired t test) and previous-day (P = 0.67, t test) experience reveal no changes in the proportion of significant trajectory-depicting frames at P15–P16 and P16 (two directions per animal, n = 3 and 4 animals). Data are means ± SEM. ***P < 0.005; **P < 0.01; *P < 0.05; ns, not significant.

