
Figure 2.
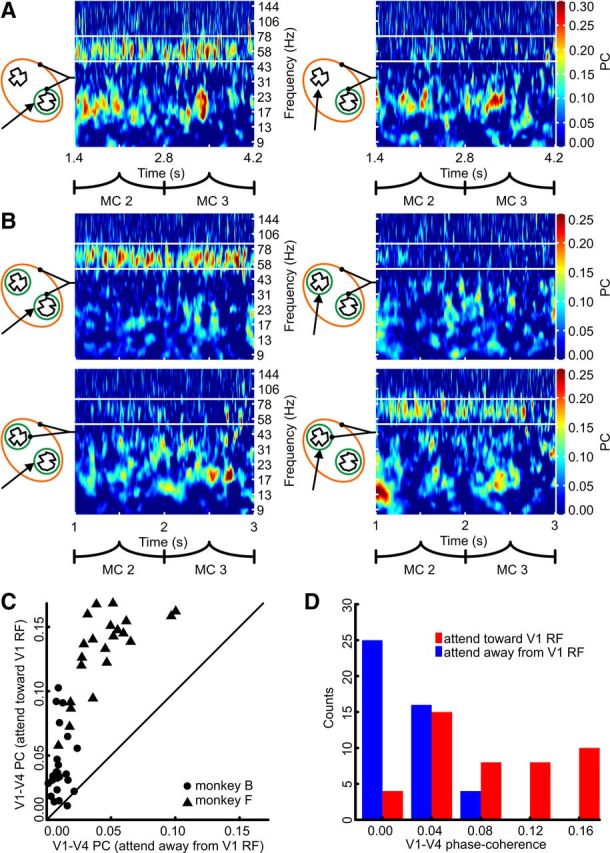
Attention differentially modulates gamma-band PC between multiple V1 subpopulations and V4. A, Example of monkey F. Black lines originating from the TF plot connect to the symbolically depicted constellation on which the TF plot was based. Orange and green circles represent the RFs, colors are as in Figure 1. Black arrows indicate attention direction. White lines delineate the TF window over which the PC was averaged. B, Example of monkey B. Labeling as in A. C, Scatter plot showing gamma-band PC difference between the attentional conditions. Each dot and triangle represents a single recording pair. D, Histograms of the gamma-band PC for the two attentional conditions (pooled data of both monkeys).