
Figure 5.
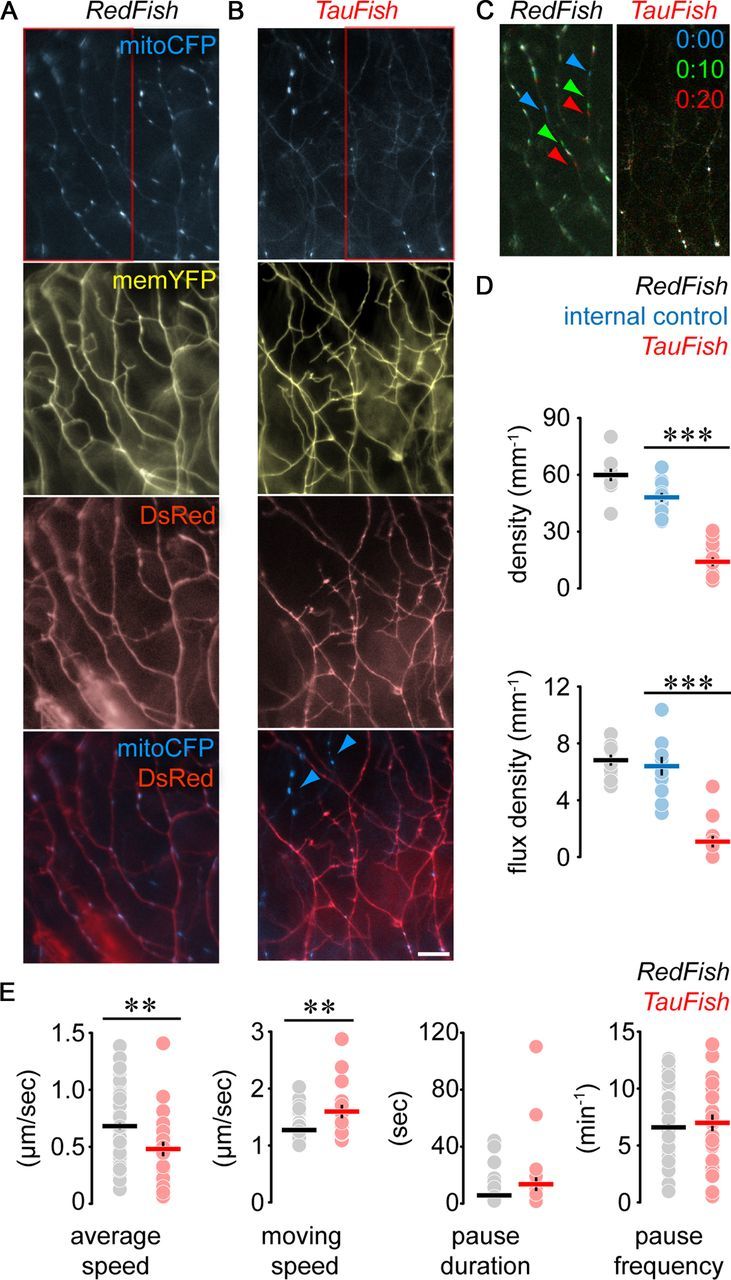
Overexpression of TauP301L reduces mitochondrial density and motility. (A, B) Peripheral RB arbors in DsRed-expressing control (A; RedFish) and TauP301L-expressing (B; TauFish) transgenic lines crossed into the MitoFish. Blue arrowheads, DsRed (and hence TauP301L)-negative neurites (internal control) in B. C, Transport of mitochondria in red boxes in A and B represented as in Figure 3D. D, Mitochondrial density (top) and flux density (bottom) in RedFish vs TauFish (also indicated are internal control neurites). E, Movement behavior of individual mitochondria in RedFish × MitoFish vs TauFish × MitoFish. Scale bar, 10 μm. Data points: D, fish; E: mitochondria; lines, mean ± SEM. Please note that in E some error bars cannot be seen, as they are smaller than the size of the data symbols.