. 2019 Oct 15;8:e47581. doi: 10.7554/eLife.47581

Figure 4. Population tuning functions and graded modulation of motor-goal activities.

(a) Average normalized tuning function. Shaded areas correspond to standard errors. Vertical arrows illustrate directions quantified in (b). (b) Comparison of (non-normalized) average firing rates at maximum direction (PDmax: red), opposite direction (OD: blue), orthogonal direction (Orth: yellow) during the planning period (300 ms before the rule-cue onset), and the baseline (gray dotted line) of all motor-goal tuned PMd (left) and PRR (right) neurons. Error bars depict standard errors (*p < αcorr at 5%, **p < αcorr at 1%, ***p < αcorr at 0.1%; Bonferroni-corrected t-test). Interpolated population tunings (a) were plotted for illustrative purposes, in which we refer to interpolated firing rates and PDs continuously between 0° and 360°. Statistical analyses are based on the original neuronal activities restricted to the four discrete directions (0°, 90°, 180°, 270°) which we had sampled in our task as shown in (b). The preferred direction of a neuron was then defined by the direction toward which the motor-goal evoked the maximum response, denoted PDmax. (c–d) Same as (a–b) for upregulating (UR) and downregulating (DR) neurons separately.

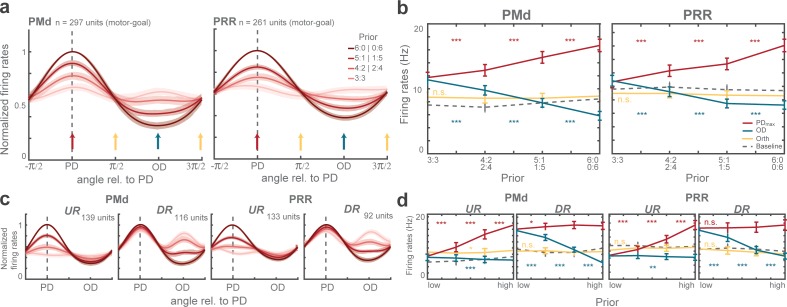
Figure 4—source data 1. Average firing rates at PDmax, OD, and Orth directions, along with interpolated tuning curve of each unit.
DOI: 10.7554/eLife.47581.012
Figure 4—source data 2. Average firing rates at PDmax, OD, and Orth directions, along with interpolated tuning curve, separately for DR and UR neurons.
DOI: 10.7554/eLife.47581.013

Figure 4.

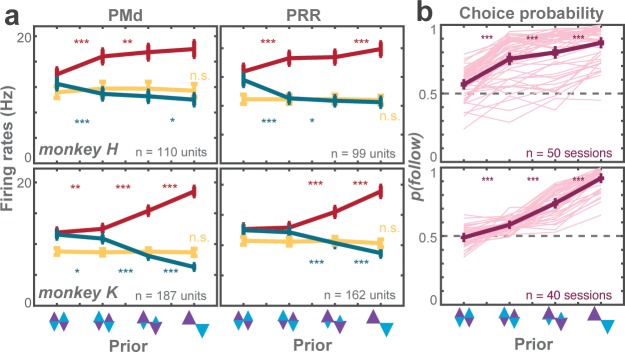
Figure 4—figure supplement 1. Planning-period activities reflect each monkey’s choice bias as function of action priors.

Figure 4—figure supplement 1.

(a) Neuronal population responses in PMd (left) and PRR (right) for monkey H (top row) and K (bottom row) as function of action prior for different prior directions relative to the PD of the neurons (conventions as in Figure 4a & c). (b) Average choice probabilities of monkey H (top) and monkey K (bottom) as function of prior. Conventions for pairwise comparisons: *p < αcorr at 5%, **p < αcorr at 1%, ***p < αcorr at 0.1%; Bonferroni-corrected t-test.
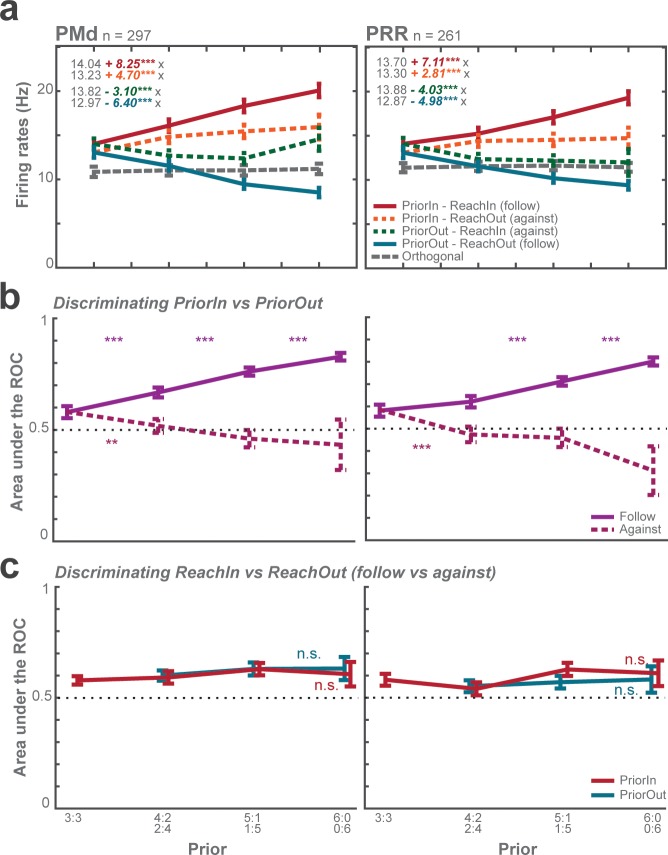
Figure 4—figure supplement 2. ROC analyses of choice predictive responses.

Figure 4—figure supplement 2.

(a) Average firing rates as function of prior and sorted according to Prior-in vs. Prior-out and Reach-in vs. Reach-out show that prior direction rather than later reach choice determines the neuronal response most strongly. This panel also shows that against choices did not result from unambiguous against reach-goal encoding, but rather from neural stochasticity; individual trials in which the effect of prior was not sufficiently strong, probabilistic against choices occurred. Each panel displays fitted equation using GLMM. (b) Average area under the ROC curves discriminating Prior-in and Prior-out trials (between-condition ROC). The ROC discriminability is low in zero-prior conditions and increases with prior. (c) Average area under the ROC curves discriminating follow and against trials as function of prior (within-condition ROC). The average discriminability of later choice stagnated around 0.6 across prior levels with no significant biasing effect in either area. This means, neuronal fluctuations across trials with the same level of action priors were not predictive about later reach choice. Taken together, the choice predictive and ROC analyses confirm that the animals did not alternate over trials between two premature unambiguous reach plans. Error bars depict standard errors. Pairwise comparisons b-c: *p < αcorr at 5%, **p < αcorr at 1%, ***p < αcorr at 0.1%; Bonferroni-corrected t-test.
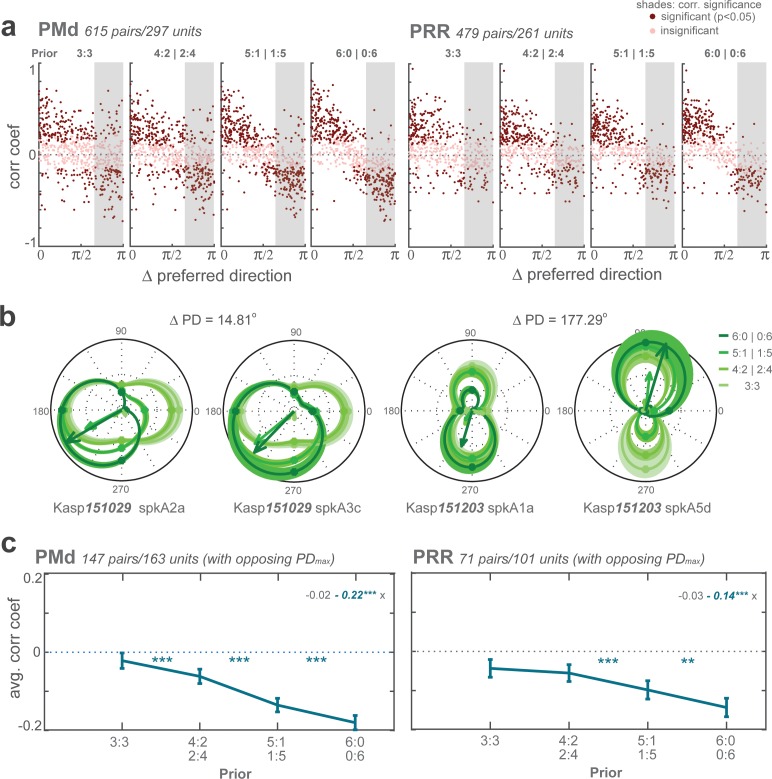
Figure 4—figure supplement 3. Neuronal co-activation analysis.

Figure 4—figure supplement 3.

(a) Trial-by-trial signal correlation between each pair of PMd (left) and PRR (right) neurons recorded in the same experimental session, plotted against difference in PD of the two neurons. Each panel represents a different level of prior. Dark color points depict significantly positive or negative correlation. By definition, during unambiguous encoding of a single motor goal, neurons with similar PD have positive signal correlations, while neurons with opposite PD have negative signal correlations. In zero-prior condition, some neurons with large distance in PD (right half of each plot) showed positive signal correlation (dark red dots on the right half above the zero-line). Shaded areas emphasize neurons with large difference in PD that are expected to show correlation reversal from negative in full-prior conditions (6:0 and 0:6) to positive in zero-prior condition (3:3). (b) Example pairs of neurons with small (left) and large (right) difference in PD (low to high prior: light to dark traces). (c) Average signal correlation as function of prior. On average over all neurons, a significant decrease in signal correlation between opposing neurons with decreasing prior. PMd showed slightly stronger decrease than PRR. These results reject the idea of alternating early commitment to a motor-goal and instead support the idea of proper co-encoding of two potential motor goals during ambiguous planning. Each panel displays the results of a GLMM for each curve. Error bars show standard errors. Pairwise comparisons: *p < αcorr at 5%, **p < αcorr at 1%, ***p < αcorr at 0.1%; Bonferroni-corrected t-test.